 (27 October 2017)
As most global markets continue to set new all-time highs, some
financial analysts are trying to make the case that stocks are not
overvalued and are not in bubble territory. Even if stocks suffer from a
pullback or correction they argue, there are many reasons why stocks
are still a good buy and should continue to rise for the forseeable
future. The Federal Reserve and other central banks have essentially
now included stock prices in their mandates since their loose monetary
policies explicitly intend to increase the value of assets like stocks
in order to increase economic activity. As long as central banks can
navigate between creating excessive inflation (from interest rates being
too low) and boosting sagging demand (from rates too high), the
argument goes, stocks are unlikely to suffer a serious bear market as
they did most recently in 2008 and in 2000.
 My own predictive record has been inconsistent recently. In previous weekly updates, I had expected the US stock market to have moved lower by October. The period from August to October featured a number of apparently bearish alignments which I thought would outweigh other bullish patterns in the charts. Alas, this has not been the case as September saw a rebound from the initial August pullback and October has seen even higher highs. How can we explain this relentless bull market?
Off the top, it is important to note that there are many factors to consider before making any kind of prediction, even a probabilistic one. One of the difficulties in financial astrology -- and all astrology for that matter --- is that every planetary alignment we encounter is literally unique and has never happened before in human history. This means that today's planetary patterns are unique and this is one reason that makes prediction more difficult. What has happened before is that the individual planets have previously been in a particular point in their cycle (e.g. Jupiter transits its current position in the 9th degree of sidereal Libra every 12-13 years).
Astrologers therefore rely on a purely deductive logic that uses one or two-factor sign placements and planetary angles in order to forecast future trends. This simplified deductive approach therefore sidesteps the more difficult problem of deriving net influences from a unique holistic matrix of all the planets. Like all human sciences, astrology is imperfect and does the best it can with the tools at hand.
So how can we explain this huge bull market that has been in place since 2009 which has seen US and other stock markets more than triple their value? Briefly stated, there must be long term factors that will outweigh shorter term passing influences like transits. While Vedic astrology often makes good use of dasha periods to identify longer term trends, they are quite sensitive to birth time inaccuracy. Since there is still some debate about the correct birth time of the New York Stock Exchange (NYSE) -- I use 10.10 a.m. but other astrologers use 8.52 a.m. and 7.52 a.m. -- a more robust technique that is less sensitive to birth time error may be the Western technique of secondary progressions. A secondary progression is a method of event timing where a single day is symbolically equivalent to a full year of clock time.
So for example, the 10th day after birth can be seen to contain some symbolic resonance in the 10th year of life. In the chart of the New York Stock Exchange, the current secondary progressed chart placements are the transit placements of the planets 225 days after its launch on 17 May 1792. Since the NYSE is in its 225th year, the logic of progressions is that the present day trends can be seen in microcosm through the position of planets on 28 December 1792, which was 225 days after its inception.

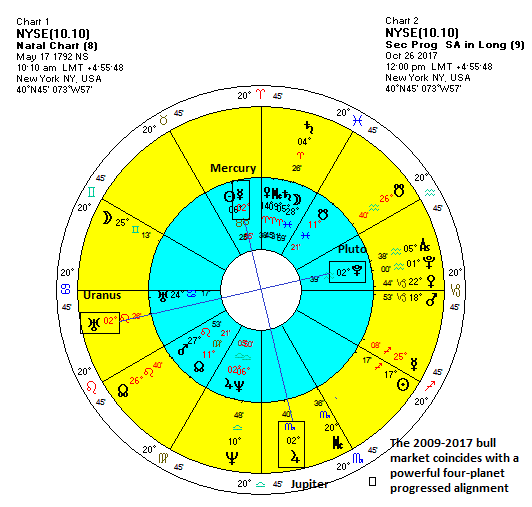
A look at this secondary progressed chart and we can see why the stock market should be in the middle of a powerful up trend in recent years. The 90 degree alignment of progressed Jupiter (2 Scorpio ) with Uranus (2 Leo) is very bullish and it is also activating the square aspect of Mercury (2 Taurus) and Pluto (2 Aquarius) in the natal chart . Jupiter is the fastest moving planet in this progressed alignment but it only moves about 12 arc minutes per year. (N.B. There are 60 arc minutes in a degree.) That means this alignment has been gradually forming over several years and only now is it near exact at 2 degrees of the respective signs. Five years ago it was situated at about 1 degree of Scorpio. This was a very positive influence which formed in the background at least five years ago and has been growing in influence as it approaches its exact alignment.
There are a couple of things to note here. First, bull markets need a series of positive alignments and a relatively smaller number of negative alignments in order to keep stocks rising in value. Once positive alignments become exact, stocks begin lose positive energy and become more vulnerable to declines as they separate. This may not happen immediately but it is frequently observed from previous instances. Jupiter is already separating from Pluto and Uranus but it has yet to form an exact 180 angle with Mercury. That happens late in 2018. It is difficult to say which aspect is more crucial for the bull market in this regard -- the Jupiter-Uranus progressed square or the Jupiter-Mercury opposition. It means there is a significant amount of uncertainty in any prediction we may make.
But the fact that this alignment is close to exact does offer confirmation that the bull market is at or fairly close to its end. It could extend for another year or so, although other factors would be necessary to provide compelling evidence one way of the other. Of course bull markets will tend to end not only after positive alignments have run their course but also when negative alignments become close to exact.

Birth time issues notwithstanding, there are no clearly negative alignments in play at the moment in this chart. In fact, we can see another positive alignment taking shape in late 2018 when Mercury, Venus and natal Uranus align near 24 degrees of their respective signs. Since progressed Venus and Mercury Rx both move fairly quickly, this may be a relatively short-lived boost to the markets. Whether it corresponds with more record highs is therefore difficult to say.
But it does suggest that some kind of up trend is likely to take place sometime in 2018 and perhaps into early 2019 around this alignment. And therefore it is possible the bull market that began in 2009 could conceivably last into 2018 and perhaps even 2019. Other negative transit alignments not found in the secondary progressions are likely to coincide with declines over the rest of 2017 and the first half of 2018 but it is unclear if they will be large enough to officially end the bull market. By definition, a bull market ends and a bear market begins after a decline of 20% or greater.

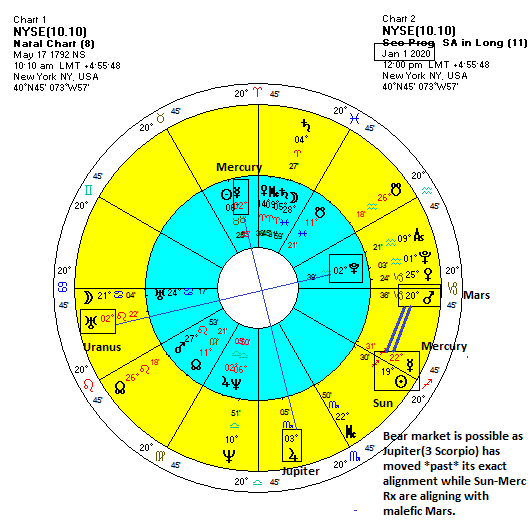
A more clearly bearish alignment looks active in 2019 when progressed Mars and the Sun align with retrograde progressed Mercury. This alignment becomes exact in 2020-2021 and it likely to correspond with a significant decline. This kind of multi-planet alignment has a better chance of ending the bull market then the lesser negative alignments in 2018. But it is still just a probabilistic prediction. It is only one chart -- the NYSE -- and it is using just one technique -- the secondary progressions. A more comprehensive prediction would require taking into account other levels of analysis including dashas, transits and other progressed charts. But the takeaway here is that this chart provides evidence for the view that this bull market is likely getting very close to its end, be that this year or next year. This chart argues against the more optimistic analysts that see stocks in some kind of semi-permanent bull market.
Weekly Market Forecast
US stocks have been a bit choppy this week as investors nervously await Donald Trump's appointment of the new Chair of the Federal Reserve. The Dow finished Thursday's session at 23,400. Indian stocks have extended their advance in October as the Sensex has moved above 33,000. I thought we might have seen a bit more downside this week on the sign change of Saturn as it entered sidereal Sagittarius. So far, there is little evidence that this passing transit influence has had any effect on dampening sentiment.
Jupiter still looks fairly strong over the next week or two as it moves further into Libra. Its conjunction with the Sun this week has been one reason for the gains and it is due to conjoin Venus on November 12th. The approach of this conjunction could well propel stocks higher for a bit longer. Even if we see some pullbacks next week, the entry of Venus into Libra next Thursday November 2ndshould offset whatever negativity that may be about. The outlook may become more tense towards the end of November.
For more details and analysis on market trends for this week, this month and this year, please check out my weekly MVA Investor Newsletter. The newsletter is published every Saturday and includes extended discussion of US and Indian stock markets, as well as gold, oil and major currencies.