Wednesday, May 24, 2023

Debt ceiling talks go down to the wire

(24 May 2023)  Financial markets are showing signs of nervousness this week as the debt ceiling drama unfolds in Washington, DC.  Stocks have posted declines over the past two days as the White House and the GOP-controlled House attempt to find areas of compromise to avoid a potentially disastrous debt default.  Treasury Secretary Janet Yellen has stated that June 1 is the X-date after which the US will not be able to meet is debt obligations, while the Congressional Budget Office has suggested it may actually be sometime later in the June.

Even if the CBO is correct and US government runs out of money later in the month of June, markets are nonetheless focused on Thursday, June 1 as a critical date.  If a deal is not reached by then, we should expect much more market turbulence as investors reassess their risk and reallocate their capital in light of this new uncertain terrain.

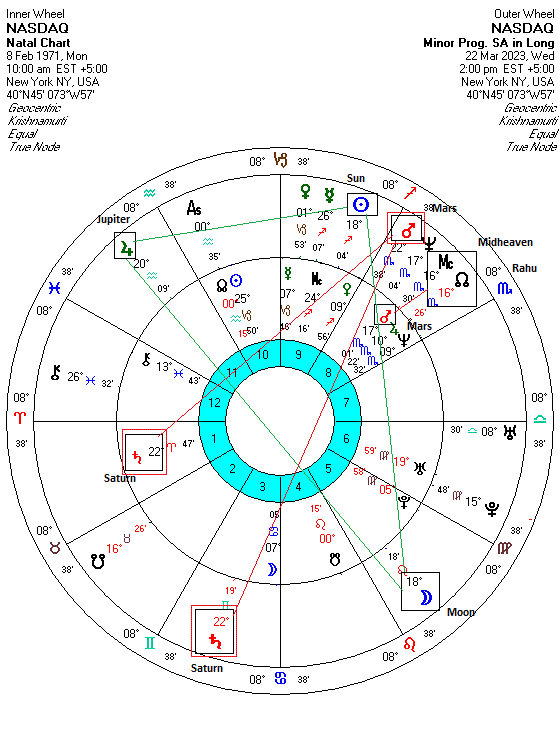
A useful astrological perspective on this situation considers the Inauguration horoscope of President Joe Biden.  The Inauguration chart for Jan 20, 2021 reflects the ups and downs of his both administration and the country according to the dominant transit influences at any given time.  Currently, we can easily see why stress levels are no doubt rising in the White House.  Transiting Mars is now opposite the 10th house alignment of the Sun (6 Capricorn), Saturn (9 Cap) and Jupiter (13 Cap).  Since Mars is the planet of frustration, conflict and anger, it is not surprising that negotiations between Joe Biden and GOP Speaker Kevin McCarthy have not shown much progress.  In recent days, Mars (6 Cancer) was exactly opposite the natal Sun and transiting Pluto at 6 Capricorn.  Mars (conflict) was in a tense alignment with the Sun (government, leaders) and Pluto (power, coercion).

By next Thursday, Mars will be closely opposite Saturn (institutions, tradition) and Jupiter (justice, prosperity).  On the face of it, this is not a good combination for a last-minute debt ceiling deal before June 1.  One might think that we merely have to wait until Mars is past its exact opposition with Jupiter on June 2 for a deal to be struck to avert a default.  That view actually makes good sense but the position of Saturn raises questions about the presence of a more significant obstacle.

Transiting Saturn (12 Aquarius) is now casting its full-strength 3rd house/60 degree aspect to the Mars-Uranus conjunction in the Inauguration chart.  This is a very stressful combination that suggests a protracted period of conflict and frustration.  Since Mars-Uranus also carries a military and violent symbolism, there is a higher risk of some noteworthy military actions taking place in the coming weeks.  The Saturn transit is particularly troublesome here since it is slowing down ahead of its retrograde station on June 17.  This means that its alignment with Mars and Uranus will be extended for several weeks through the entire month of June and even into July.

In fact, stress levels are likely to rise further next week since transiting Mars (12 Cancer) will aspect Saturn (12 Aquarius) by its most malefic 8th house/210 degree aspect.  In this way, the Mars-Saturn aspect will activate the Mars-Uranus conjunction and the natal Jupiter at the same time.

What could this mean?  If it were only Mars afflicting planets in the natal chart, we would expect the usual 11th hour deal before any serious damage is done.  But the presence of Saturn here also suggests this situation could be more serious.  If Mars is the trigger, It could still resolve fairly quickly after June 2, but the damage to national credibility may be more severe.  While an outright default seems impossible, this double affliction by Mars and Saturn in the Inauguration chart alerts us to the possibility of the situation getting worse than many expect.

For more details, check out my weekly subscriber newsletter which is published every Sunday.   In addition to reviewing the key planetary and technical influences on US and Indian stocks for the short and medium term, I also provide an astrological analysis of potential upcoming moves in currencies, gold and oil.

These updates are usually posted midweek.  You can be notified of new posts by following me on Twitter.

Wednesday, May 17, 2023

Solar Return: the NYSE was founded 231 years ago today

(17 May 2023)  The New York Stock Exchange celebrated a birthday today as the world’s largest securities market is now 231 years old.  The NYSE was founded as the Sun transited the 6th degree of sidereal Taurus, perhaps not coincidentally, the sign of the bull.  Due to the precession of the equinoxes, the Sun didn’t actually transit that degree today but will instead mark its exact solar return to 6 Taurus on May 21.  The resulting solar return chart is said to provide an overview of some of the central themes that will shape the fortunes of the NYSE for the coming year.

The chart looks potent with a number of close alignments in play.  As a rule, solar return charts should be interpreted both on their own and in relation to the natal chart. Alignments involving benefic planets tend to indicate growth and increase the likelihood of positive returns while a preponderance of malefic aspects may undermine sentiment and thus increase the risk of declines.

There are several potentially negative alignments here.  First, the Mars-Pluto opposition across the 1-7 axis is a very difficult placement.  Even if we throw out the impact of the conjunction with the Ascendant since there is some uncertainty about the 8.52 a.m birth time, the closeness of the Mars-Pluto opposition is clearly bearish, especially since Mars is in Cancer, its sign of debilitation.  While it may not, by itself, be sufficient to translate into a down year for stocks, it does suggest some significant volatility is likely over the next 12 months.


But the fact that this bearish opposition also forms a tense square alignment with a close Jupiter-Rahu conjunction is another red flag. Jupiter-Rahu conjunctions tend to be bearish on their own as Rahu’s disruptive influence works to undermines Jupiter’s confident optimism.  In an individual’s chart, this can sometimes manifest as a compulsive materialism and acquisitiveness as one might find with an over-confident person.  And indeed in terms of the stock market, it can be temporarily bullish.  But more often, the Jupiter-Rahu conjunction is associated with periods of economic instability and stock market declines.

Interestingly, the Jupiter-Rahu conjunction forms a fairly close square to the Mars-Pluto opposition.  That’s another possible warning sign, although it may simply represent an intensification of energy.  Taking a more sanguine view of this alignment, it could represent major developments in the stock market that keeps it in the public eye over the next year.  This could therefore come from moves up or down — or both.

The other aspect of note here is that of Mercury-Saturn.  Saturn casts its full-strength 3rd house/60 degree aspect to Mercury, just one degree from exact.  Saturn is usually a bearish influence upon Mercury, even if Mercury is separating from Saturn here.  So that’s another likely bearish influence in the chart.

The other layer of interpretation concerns how the return chart overlays the natal chart.  The Mars-Pluto-Jupiter-Rahu alignment highlights the Saturn-Neptune opposition in the natal chart. This is also not a plus since the Saturn-Neptune opposition is a very negative influence.  Since Mars and Pluto are also negative, there is an elevated risk for a significant correction in the coming year with this pattern.

If there is a silver lining here, it is that neither the Sun nor the Moon are afflicted in either the natal or the solar return chart. Since the Sun and Moon are the most important points in the chart — after the Ascendant, that is — the absence of any strong affliction could offer some hope that the stock market may manage to avoid the worst.

But the bottom line here is that the solar return chart looks very challenging.  While it is important to remember that solar return charts do not have the final say in terms of predictive influence, the negatives in this chart do not augur well for the coming year.

For more details, check out my weekly subscriber newsletter which is published every Sunday.   In addition to reviewing the key planetary and technical influences on US and Indian stocks for the short and medium term, I also provide an astrological analysis of potential upcoming moves in currencies, gold and oil.

These updates are usually posted midweek.  You can be notified of new posts by following me on Twitter.

Photo Credit: josullivan.59

Wednesday, May 10, 2023

Stocks rise after CPI; Mercury approaches its direct station

(10 May 2023) US stocks ended higher Wednesday after the latest CPI report showed another decline in annual inflation to 4.9%.  While the core inflation number was unchanged at 5.5%, markets nonetheless welcomed the continued easing of price pressures as the dollar and bond yields finished the day lower.

Stocks appear to be moving sideways in recent days as optimism from falling inflation has been largely offset by ongoing concerns over the banking system and the prospect of some political brinkmanship over the impending US debt ceiling deadline on June 1 or thereabouts.

This mixed outlook may be reflected in the current planetary influences.  Bullish sentiment is due in part to the approaching Jupiter-Pluto square.  As is the case with most Jupiter alignments, this pairing is usually bullish, even if the 90-degree square angle can be less positive than other angles such as the conjunction or the 120-degree trine.

And yet Saturn is also an active influence through its ongoing 120-degree aspect from Ketu (South Lunar Node).  While this alignment is separating, it is still within effective range.  More immediately, however, we note that Mercury is backing into an alignment with Rahu (North Lunar Node) and Saturn as it culminates its 23-day retrograde cycle.   Although it is a benefic planet by nature, Mercury is more commonly associated with bearishness when it is aligned with malefic planets such as Rahu and Saturn.


Mercury is due to end its retrograde cycle late in the evening (ET) on Sunday, May 14 when it will station direct and resume its normal forward motion.   At the time of the station, Mercury will be in a three-degree conjunction with Rahu and in near-exact 60-degree alignment with Saturn.  Taken together, these influences look bearish for market sentiment.

Of course, since the station occurs when markets are closed on Sunday, it is possible that some of the worst effects of this pattern could be mitigated.  Nonetheless, Mercury will be in close alignment with both Rahu and Saturn for several days both before and after its direct station.  With that in mind, it is best to think of Mercury as passing through a window of vulnerability where its normally benefic nature can be subverted by negative influences.

This affliction therefore seems likely to coincide with a rise in volatility in the days ahead.

For more details, check out my weekly subscriber newsletter which is published every Sunday.   In addition to reviewing the key planetary and technical influences on US and Indian stocks for the short and medium term, I also provide an astrological analysis of potential upcoming moves in currencies, gold and oil.

These updates are usually posted midweek.  You can be notified of new posts by following me on Twitter.

Photo Credit: Dean Hochman

Wednesday, May 3, 2023

Fed hikes rates ahead of Friday's lunar eclipse

(3 May 2023) As expected, the Fed hiked interest rates another 25 basis points today as part of their ongoing effort to curb inflation.  While Fed Chair Jerome Powell acknowledged the possibility of pausing the tightening cycle in June if it was warranted by the data, he remained somewhat non-committal about the direction of interest rates for the rest of the year.  While mere mention of a possible pause was welcome news to investors, the market eventually sold off late this afternoon as the uncertainty surrounding the Fed’s future rate path began to sink in.

Markets have been looking more vulnerable in recent days as economic data is showing more signs of softening.  And yet if inflation continues to be elevated while the economy is slowing, it could paint the Fed into a corner without any obvious escape plan.  Chair Powell is hoping that the impending recession will do most of the Fed’s dirty work as layoffs will dampen wage growth and thus break the wage-price feedback loop.

This period of choppy volatility may not yet be done as we approach Friday’s lunar eclipse.  The eclipse is due to reach its maximum at 1.33 p.m. New York time.  While eclipses tend to have bad astrological reputations as they are often seen as harbingers of difficulty and disruption, this isn’t always the case as far as the stock market is concerned.   In fact, some eclipses pass without any significant market reaction at all.  This one is a bit more suspect, however, since it occurs at 20 Libra, just four degrees from an opposition with Uranus, the planet of sudden and unexpected changes.  And yet it’s possible that the Venus-Jupiter-Neptune alignment could exert a short term mitigating effect.


But the larger planetary picture is looking somewhat unstable.  The most obvious potential trouble spot involves retrograde Mercury which is slowly backing into a near-conjunction with Rahu (North Lunar Node) ahead of its direct station on May 14 at 11 Aries.  And both Mercury and Rahu come under the influence of the full-strength 3rd house/60 degree aspect from Saturn.  Aside from any potential eclipse effects, this is a decidedly difficult alignment.  We should therefore be open to the possibility that collective sentiment could worsen next week when this alignment makes its closest approach.

For more details, check out my weekly subscriber newsletter which is published every Sunday.   In addition to reviewing the key planetary and technical influences on US and Indian stocks for the short and medium term, I also provide an astrological analysis of potential upcoming moves in currencies, gold and oil.

These updates are usually posted midweek.  You can be notified of new posts by following me on Twitter.

Photo Credit: AdamChandler86

Wednesday, April 26, 2023

Stocks fall after UPS warns amid fresh banking jitters

(26 April 2023) Stocks have moved lower so far this week on renewed banking sector fears after First Republic Bank reported a shocking loss of 40% of its deposits in the first quarter.  Not even earnings beats from tech giants Microsoft and Google were enough to offset the banking jitters and the pessimistic forward guidance of transportation bellwether UPS.  As Dow theory tells us, underperformance by transportation stocks suggests the broader markets will likely trend lower over time.  It’s not a good omen.

This week’s decline is a clear manifestation of a double affliction to the Sun.  The Sun (10 Aries) was not only conjunct Rahu (North Lunar Node) on Monday and Tuesday, but it was also under the simultaneous and exact 3rd house/60 degree aspect of Saturn (10 Aquarius).  Since both Rahu and Saturn are considered malefics, it is not surprising that this double affliction to the Sun should have coincided with a loss of investor confidence and a market decline.  In astrology, the Sun symbolizes confidence and vitality.

Sentiment was even more likely to be damaged since this difficult Sun-Rahu-Saturn alignment occurred near sensitive points in some relevant market horoscopes.  For example, the Ascendant (8 Aries) of the NASDAQ chart (Feb 8, 1971) is directly impacted by this malefic alignment as it is only 2 degrees from the Sun-Rahu conjunction.  Saturn’s square aspect to the Jupiter-Neptune conjunction has also not been helpful.


With Rahu and Saturn now moving past their exact alignment, it could be that the market may be in a better position to rebound. While that is possible, I would note that Rahu, which always moves in retrograde motion, is approaching its exact conjunction with the Ascendant at 8 Aries.  This could destabilize the market for a while longer, even if the Saturn influence is diminishing in the coming days.

We should carefully monitor the movement of retrograde Mercury here, since it is next to fall under the exact aspect of Saturn.  It will form an exact 60 degree aspect with Saturn between May 11 and May 18 just as it completes its retrograde cycle.  Mercury is due to station direct on May 14 at 11 Aries when it will resume its normal forward motion and begin to escape from the pessimistic and disruptive influences of Saturn and Rahu.

For more details, check out my weekly subscriber newsletter which is published every Sunday.   In addition to reviewing the key planetary and technical influences on US and Indian stocks for the short and medium term, I also provide an astrological analysis of potential upcoming moves in currencies, gold and oil.

These updates are usually posted midweek.  You can be notified of new posts by following me on Twitter.


Photo Credit: Ryan McKnight

Wednesday, March 29, 2023

Stocks recover as banking fears subside

(29 March 2023) US stocks have bounced in recent days as the banking crisis has faded from the headlines after a series of carefully-orchestrated bailouts and buyouts.  The major indexes have been slowly pushing their way back up towards their early February highs.  While the rebound has temporarily put on hold all the doom and gloom talk about the economy, we should note that stocks have basically moved sideways since November.

Following on my previous examination of the use of progressed cycles in natal charts, I thought we would explore how this timing technique can be used in the horoscope of the S&P 500 index.  This is arguably the most important stock index in the world as it covers the 500 largest publicly-traded companies in the US.  Founded in 1957, the S&P 500 provides an indispensable window on the fluctuations in collective sentiment that influence stock prices.

By way of example, we are focusing solely on the minor progressed chart.  This progression is based on the lunar month such that the length of lunar month (29 days) is equivalent to one year of calendar time.  The minor progressed chart cast for today (March 29, 2023) is derived from the planetary positions for February 11, 1962.  The resulting 1:13 time compression provides a useful bridge between the often fast-moving transits and much slower progressions such as the day-for-a-year secondary progressions.


Looking at today’s progressed chart, we can see two potentially significant groupings of planets.  At the top of the chart, is a conjunction of Venus, Sun and Jupiter.  This is clearly a bullish arrangement which may partially explain the recent rebound in stocks.  However, we should note that the faster-moving Sun (29 Capricorn) and Venus (2 Aquarius) are now clearly separating from Jupiter (26 Capricorn).  This suggests that whatever the bullish influence of this triple conjunction, it is now likely on the wane.  It is possible that the close 90-degree alignment with the Moon has recently activated another pulse of this bullish Venus-Sun-Jupiter energy, however.  Since the minor progressed Moon moves about one degree per day, this influence is likely to diminish fairly soon also.

But the other obvious pattern is the conjunction of retrograde Mercury (16 Capricorn) with Mars (14 Capricorn) and Saturn (11 Capricorn).  Mars is well past Saturn now so that is likely no longer a major influence.  But since Mercury is moving backwards it will form an exact conjunction with Mars in the coming weeks.  In fact, the exact conjunction is due to occur on April 16.   Since Mercury-Mars alignments are generally bearish for stocks, it is quite possible that markets could come under pressure once again around the time of this conjunction.  The fact that both planets will also align with Pluto may serve to amplify its negative effects.

While the Mercury-Mars conjunction still has yet to reach its theoretical maximum impact, we should note that the progressed Ascendant (11 Aries) is square progressed Saturn (11 Capricorn).  That is a negative influence that argues for some weakness in the very near term.

The bottom line here is that the minor progressed chart looks increasingly difficult as we head into April.   So when will the market drop?   The Mercury-Mars conjunction is within close enough range that prices could begin to decline at any time.  That said, the probability for a decline rises the closer we get to the April 16 conjunction date.  Even in that case, it is possible that some of the associated decline may actually occur after April 16.  In that sense, the date of conjunction should be seen in probabilistic terms.

Of course, the usual caveats apply.  This minor progressed chart is only one of many such derived progressed cycles and thus form only a single slice of the overall forecast picture.

For more details, check out my weekly subscriber newsletter which is published every Sunday.   In addition to reviewing the key planetary and technical influences on US and Indian stocks for the short and medium term, I also provide an astrological analysis of potential upcoming moves in currencies, gold and oil.

These updates are usually posted midweek.  You can be notified of new posts by following me on Twitter.

Wednesday, March 22, 2023

Markets decline after Fed hikes another 25 basis points

(22 March 2023)  Investors hit the sell button today after Fed Chair Jerome Powell delivered hawkish comments in his FOMC press conference after raising interest rates another 25 basis points.  Despite lingering uncertainty from recent bank failures, Powell remained committed to fighting inflation and ruled out any rate cuts in 2023.  Powell’s bucket of cold water came a surprise to some as markets had been pricing in at least two rate cuts in the second half of 2023 in the wake of the collapse of the Silicon Valley Bank.

The decline coincided with a exact 45-degree alignment of Jupiter and Saturn.  Although the 45-degree alignment is not a traditional Vedic aspect, Jupiter and Saturn were closely conjunct in the D-8 Ashthamsa chart, which corresponds to the 8th harmonic chart.  The blending of the energies of Jupiter and Saturn tends to be bearish as the slower speed of Saturn usually gets the final word in against Jupiter’s preference for optimism.   The other potential bearish influence here is the approaching alignment of Mars (4 Gemini), Ketu (10 Libra) and Saturn (7 Aquarius).  Each planet is separated by about 120 degrees in this Grand Trine pattern and thus creates a resonance where the energies of the planets are amplified.  Since all three planets are natural malefics, it is not unexpected that stocks fell with the approach of this pattern.


We can also see how today’s decline might have manifested in the 13-day progressed cycle chart.  This 13-day cycle is another way to describing the minor progressed chart where the arrangement of the planets one lunar month after birth is symbolically equivalent to one full year of life.  The resulting 1:13 time compression can provide insights into future trends that are sometimes not apparent in the standard transit chart.


Looking at the NASDAQ horoscope (Feb 8 1971, 10.00 a.m.), we can see that this week’s planets feature some difficult alignments.  Progressed Mars (22 Scorpio) aligns with both progressed Saturn (22 Gemini) and natal Saturn (22 Aries).  While neither of these alignments are full-strength aspects, their precise geometry is nonetheless important.  Since Mars and Saturn are both malefic planets, their alignments are more likely to coincide with negative sentiment and stock market declines.

But compared with transits, progressed planets move much more slowly.  For example, transiting Mars moves about 35-40 minutes of arc per day.  Minor progressed Mars moves just 3 arc minutes per day, while this progressed retrograde Saturn moves just 3 arc seconds per day.  This means that the Mars-Saturn-Saturn alignment will be within range for much longer than a simple Mars transit.  This suggests that today’s negative sentiment could last for a while longer.

While this is a difficult chart, we should be careful not to place too much emphasis on it as it is only one cycle out of many possible cycles.  It is possible it could be offset by transits, or the 27-day progressed cycle for the NASDAQ chart, or indeed the cumulative influences from the other relevant natal charts such as the NYSE chart (as noted in last week’s update) or the S&P 500 chart, among others.

Other possible caveats here is the upcoming Sun-Jupiter alignment in this minor progressed chart.  This is a more bullish influence that is likely to bring some upside over the next several weeks when the alignment tightens.  Using its exact alignment as its theoretical maximum influence, the bullish influence from this 13-day cycle chart is likely to peak sometime in the second half of April.  Significantly, by that time Mars will have moved two full degrees past both progressed Saturn and natal Saturn.  This suggests that the negative energy in this particular chart is more likely to have waned while the positive energy will be on the rise.

For more details, check out my weekly subscriber newsletter which is published every Sunday.   In addition to reviewing the key planetary and technical influences on US and Indian stocks for the short and medium term, I also provide an astrological analysis of potential upcoming moves in currencies, gold and oil.

These updates are usually posted midweek.  You can be notified of new posts by following me on Twitter.