Wednesday, March 29, 2023

Stocks recover as banking fears subside

(29 March 2023) US stocks have bounced in recent days as the banking crisis has faded from the headlines after a series of carefully-orchestrated bailouts and buyouts.  The major indexes have been slowly pushing their way back up towards their early February highs.  While the rebound has temporarily put on hold all the doom and gloom talk about the economy, we should note that stocks have basically moved sideways since November.

Following on my previous examination of the use of progressed cycles in natal charts, I thought we would explore how this timing technique can be used in the horoscope of the S&P 500 index.  This is arguably the most important stock index in the world as it covers the 500 largest publicly-traded companies in the US.  Founded in 1957, the S&P 500 provides an indispensable window on the fluctuations in collective sentiment that influence stock prices.

By way of example, we are focusing solely on the minor progressed chart.  This progression is based on the lunar month such that the length of lunar month (29 days) is equivalent to one year of calendar time.  The minor progressed chart cast for today (March 29, 2023) is derived from the planetary positions for February 11, 1962.  The resulting 1:13 time compression provides a useful bridge between the often fast-moving transits and much slower progressions such as the day-for-a-year secondary progressions.


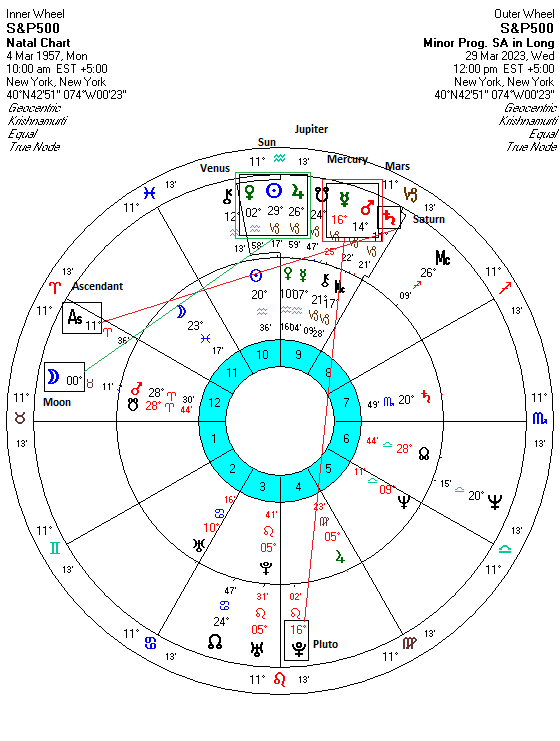
Looking at today’s progressed chart, we can see two potentially significant groupings of planets.  At the top of the chart, is a conjunction of Venus, Sun and Jupiter.  This is clearly a bullish arrangement which may partially explain the recent rebound in stocks.  However, we should note that the faster-moving Sun (29 Capricorn) and Venus (2 Aquarius) are now clearly separating from Jupiter (26 Capricorn).  This suggests that whatever the bullish influence of this triple conjunction, it is now likely on the wane.  It is possible that the close 90-degree alignment with the Moon has recently activated another pulse of this bullish Venus-Sun-Jupiter energy, however.  Since the minor progressed Moon moves about one degree per day, this influence is likely to diminish fairly soon also.

But the other obvious pattern is the conjunction of retrograde Mercury (16 Capricorn) with Mars (14 Capricorn) and Saturn (11 Capricorn).  Mars is well past Saturn now so that is likely no longer a major influence.  But since Mercury is moving backwards it will form an exact conjunction with Mars in the coming weeks.  In fact, the exact conjunction is due to occur on April 16.   Since Mercury-Mars alignments are generally bearish for stocks, it is quite possible that markets could come under pressure once again around the time of this conjunction.  The fact that both planets will also align with Pluto may serve to amplify its negative effects.

While the Mercury-Mars conjunction still has yet to reach its theoretical maximum impact, we should note that the progressed Ascendant (11 Aries) is square progressed Saturn (11 Capricorn).  That is a negative influence that argues for some weakness in the very near term.

The bottom line here is that the minor progressed chart looks increasingly difficult as we head into April.   So when will the market drop?   The Mercury-Mars conjunction is within close enough range that prices could begin to decline at any time.  That said, the probability for a decline rises the closer we get to the April 16 conjunction date.  Even in that case, it is possible that some of the associated decline may actually occur after April 16.  In that sense, the date of conjunction should be seen in probabilistic terms.

Of course, the usual caveats apply.  This minor progressed chart is only one of many such derived progressed cycles and thus form only a single slice of the overall forecast picture.

For more details, check out my weekly subscriber newsletter which is published every Sunday.   In addition to reviewing the key planetary and technical influences on US and Indian stocks for the short and medium term, I also provide an astrological analysis of potential upcoming moves in currencies, gold and oil.

These updates are usually posted midweek.  You can be notified of new posts by following me on Twitter.

Wednesday, March 22, 2023

Markets decline after Fed hikes another 25 basis points

(22 March 2023)  Investors hit the sell button today after Fed Chair Jerome Powell delivered hawkish comments in his FOMC press conference after raising interest rates another 25 basis points.  Despite lingering uncertainty from recent bank failures, Powell remained committed to fighting inflation and ruled out any rate cuts in 2023.  Powell’s bucket of cold water came a surprise to some as markets had been pricing in at least two rate cuts in the second half of 2023 in the wake of the collapse of the Silicon Valley Bank.

The decline coincided with a exact 45-degree alignment of Jupiter and Saturn.  Although the 45-degree alignment is not a traditional Vedic aspect, Jupiter and Saturn were closely conjunct in the D-8 Ashthamsa chart, which corresponds to the 8th harmonic chart.  The blending of the energies of Jupiter and Saturn tends to be bearish as the slower speed of Saturn usually gets the final word in against Jupiter’s preference for optimism.   The other potential bearish influence here is the approaching alignment of Mars (4 Gemini), Ketu (10 Libra) and Saturn (7 Aquarius).  Each planet is separated by about 120 degrees in this Grand Trine pattern and thus creates a resonance where the energies of the planets are amplified.  Since all three planets are natural malefics, it is not unexpected that stocks fell with the approach of this pattern.


We can also see how today’s decline might have manifested in the 13-day progressed cycle chart.  This 13-day cycle is another way to describing the minor progressed chart where the arrangement of the planets one lunar month after birth is symbolically equivalent to one full year of life.  The resulting 1:13 time compression can provide insights into future trends that are sometimes not apparent in the standard transit chart.


Looking at the NASDAQ horoscope (Feb 8 1971, 10.00 a.m.), we can see that this week’s planets feature some difficult alignments.  Progressed Mars (22 Scorpio) aligns with both progressed Saturn (22 Gemini) and natal Saturn (22 Aries).  While neither of these alignments are full-strength aspects, their precise geometry is nonetheless important.  Since Mars and Saturn are both malefic planets, their alignments are more likely to coincide with negative sentiment and stock market declines.

But compared with transits, progressed planets move much more slowly.  For example, transiting Mars moves about 35-40 minutes of arc per day.  Minor progressed Mars moves just 3 arc minutes per day, while this progressed retrograde Saturn moves just 3 arc seconds per day.  This means that the Mars-Saturn-Saturn alignment will be within range for much longer than a simple Mars transit.  This suggests that today’s negative sentiment could last for a while longer.

While this is a difficult chart, we should be careful not to place too much emphasis on it as it is only one cycle out of many possible cycles.  It is possible it could be offset by transits, or the 27-day progressed cycle for the NASDAQ chart, or indeed the cumulative influences from the other relevant natal charts such as the NYSE chart (as noted in last week’s update) or the S&P 500 chart, among others.

Other possible caveats here is the upcoming Sun-Jupiter alignment in this minor progressed chart.  This is a more bullish influence that is likely to bring some upside over the next several weeks when the alignment tightens.  Using its exact alignment as its theoretical maximum influence, the bullish influence from this 13-day cycle chart is likely to peak sometime in the second half of April.  Significantly, by that time Mars will have moved two full degrees past both progressed Saturn and natal Saturn.  This suggests that the negative energy in this particular chart is more likely to have waned while the positive energy will be on the rise.

For more details, check out my weekly subscriber newsletter which is published every Sunday.   In addition to reviewing the key planetary and technical influences on US and Indian stocks for the short and medium term, I also provide an astrological analysis of potential upcoming moves in currencies, gold and oil.

These updates are usually posted midweek.  You can be notified of new posts by following me on Twitter.

Wednesday, March 15, 2023

The NYSE Horoscope: Understanding the 27-day progressed cycle


(15 March 2023) One indispensable tool in the astrologer's toolkit is the planetary progression.  Progressed cycles, or progressions, are a Western astrological technique which yields unique information about future trends, both for financial markets and for individual life outcomes.  Briefly stated, a progression moves a horoscope symbolically forward through time at particular rates that are based on the motion of the Sun and Moon.  The more common secondary progression moves a horoscope forward at a rate of one calendar day for a year of life.  So to determine the dominant influences on an individual's life at the age of 30, we can progress the chart forward by 30 days from birth and analyze the key aspects and planetary placements with respect to the natal chart.

Less commonly used are the tertiary and minor progressions, which are calculated based on the motion of the Moon.  A tertiary progression assumes the symbolic equivalence of one calendar day with one lunar month of life (about 27 days) while minor progressions equate one lunar month with one year of life, which produces a time compression factor of about 13.  It is therefore possible to determine future trends based on the planetary positions of these progressions.

Progressions can therefore be thought of as time-gears, each having a different ratio.  If the Sun-based secondary progression has a time-gear ratio of 1:365, tertiary progressions can be understood as a 27-day cycle with a compression ratio of 1:27, while the minor progression is a 13-day cycle with a time compression of 1:13.  Shorter progressed cycles such as the 13-day minor progression are more responsive to the passage of time and are therefore more accurate for predictive purposes.  And yet because they are faster-moving, they are less powerful in terms of decisively shaping outcomes.  In this way, progressions adhere to the standard astrological principle that the slower the planet, the more powerful it is.  However, the paradox is that the slower the planet, the more difficult it is to accurately predict the timing of its worldly manifestation.

By way of example, let's take a look at the tertiary progressed 27-day cycle of the New York Stock Exchange chart (May 17, 1792).  Currently, we can see there is one very close aspect of note: progressed Mercury (28Li30) is opposite progressed retrograde Mars (29Ar14).   Tertiary progressions move much slower than transits, so it is important to remember that the motion a planet would move in one day equals about one month of clock time.   Since Mercury moves a bit more than one degree per day, this equates to about one degree for every four weeks of clock time.  Here Mars is retrograde and moving much more slowly -- just one degree in three months.  With the two planets moving towards each other, they will form an exact opposition on March 26.

As a rule, Mercury-Mars aspects are usually negative and the 180-degree opposition is especially so.  The close proximity of this bearish aspect is one reason why stocks have been declining in recent weeks as the opposition tightens.   The Moon-Venus-Uranus alignment could offer some relief in the near term, but it doesn't look as strong.  Also, the Moon moves much quicker and will only be within range for 2 or 3 days.  And Tuesday's bounce may well have used up some of its positive energy already.  Once it moves away, the Venus-Uranus alignment likely won't be close enough to offset the effect of the ongoing Mercury-Mars aspect.

While the March 26 date is significant for understanding the theoretical maximum of this bearish aspect, it does not necessarily mean that the stock market will bottom at that time.  Other factors are also part of the overall equation, including transits, 13-day minor progressions, and indeed, other relevant charts (S&P 500, NASDAQ, etc.).

We would therefore have to reassess the overall market situation once the progressed opposition of Mercury and Mars begins to separate on March 27.

Nonetheless, the possible continuing of this bearish energy going into March 26 suggests a sustainable rebound is less likely in the coming days.

For more details, check out my weekly subscriber newsletter which is published every Sunday.   In addition to reviewing the key planetary and technical influences on US and Indian stocks for the short and medium term, I also provide an astrological analysis of potential upcoming moves in currencies, gold and oil.

These updates are usually posted midweek.  You can be notified of new posts by following me on Twitter.

Photo Credit: alex.ch

Wednesday, March 8, 2023

Ukraine facing possible defeat in Bakhmut


(8 March 2023) The war continues in Ukraine will no end in sight.  The first anniversary of Russia’s invasion of Ukraine two weeks ago was marked by little fanfare by either side as the war has entered a more punishing, attritional phase.  Ukraine regained some of its lost territory in the fall but the winter has seen Russia counterattack as Putin’s armies remain in control of much of the four contested provinces in the east.

Fighting has been particularly intense in the strategic town of Bakhmut and it now looks as though Russia is on the verge of capturing it.  Both sides had funneled considerable resources of men and materiel into the town with thousands of dead and wounded on both sides.  While objective reporting of the war is hard to find, it seems that Russia may be taking the upper hand as equipment shortages are hampering Ukraine’s effectiveness on the battlefield.  Newly-pledged NATO tanks may be greatly appreciated by President Zelenskiy, but it could be some months yet before they can make a difference.

The horoscope of Ukraine suggests they are in a very tough spot at the moment.    Transiting Saturn (6 Aquarius) is forming a very close opposition to all of those planets in early Leo.  The Saturn influence on Jupiter, Mercury and Venus reflects the economic devastation that Russia has inflicted on its infrastructure as Ukraine has become almost entirely dependent on NATO financial and military support.  Its economy has been so thoroughly disrupted that even government payments to its senior citizens is now being supplied by the US.   And now the Saturn opposition is approaching the Sun, the planet that signifies government and its leadership. Zelenskiy himself may be facing a difficult situation in the coming days as the probable loss of Bakhmut could seriously erode moral and confidence and cause some of its allies to question their sponsorship.

More immediately, we can see a very intense Mars alignment occurring in the middle of next week.  On Wednesday, March 15, natal Mars (1 Virgo) will be exactly squared by transiting Mars (1 Gemini) and opposed by both the Sun (0 Pisces) and Neptune (1 Pisces).  The transiting Moon on Wednesday morning completes the high-energy Grand Cross alignment which should coincide with a significant Mars-type event.  Since Mars signifies the military, of course, it seems likely that Ukraine will suffer a military defeat.  Given the deteriorating situation in Bakhmut, it is possible that it will finally be lost to the Russians on or near this day.  That said, the other afflictions in the chart suggests it could actually be an even more important setback which damages the government (Saturn-Sun) in some way other than a loss of a single town.

It is unclear how financial markets might react to a major Ukrainian military defeat.  Markets have likely largely discounted the probable loss of Bakhmut, so it is unlikely is a simple defeat there would move markets very much.  But if there is additional political fallout from some such setback, it could have a larger impact on investor sentiment.  And with Tuesday’s much-awaited US CPI number, next week is shaping up to be a memorable one in the markets.

For more details, check out my weekly subscriber newsletter which is published every Sunday.   In addition to reviewing the key planetary and technical influences on US and Indian stocks for the short and medium term, I also provide an astrological analysis of potential upcoming moves in currencies, gold and oil.

These updates are usually posted midweek.  You can be notified of new posts by following me on Twitter.

Photo Credit: UNICEF Ukraine

Wednesday, March 1, 2023

10-year Treasury yield hits 4% on renewed inflation fears


(1 March 2023)
Despite the Fed’s concerted efforts to tighten monetary policy over the past year, inflation remains a major problem for the economy.  Today’s ISM manufacturing price report came in stronger than expected, renewing fears that we may be facing a fresh wave of price increases.  Not surprisingly, stocks fell and bond yields moved higher as investors recalibrated their expectations regarding further interest rate hikes.  With the benchmark 10-year Treasury now trading above the psychologically important 4% level, it now seems certain that the Fed will be forced to raise rates much higher than previously expected.

The return of inflation is not unexpected.  In a December post, I speculated that bond yields would likely move higher in spring given the afflictions in the horoscope of US Treasuries.  While it isn’t quite spring yet, it’s still very close, especially since the specified aspect is well within range.  In addition to the harmful ongoing Saturn dasha influence that will last into September 2023, the key measurement in this respect is the opposition aspect from Saturn (5 Aquarius) to the natal Sun (5 Leo).  This aspect is fast approaching its exact opposition, even if its effects can linger for days or sometimes even weeks after the precise 180-degree aspect.


We can also see that the Treasury chart is also under pressure from the transit of Mars (25 Taurus).  It is approaching its natal position (0 Gemini) in the 10th house at the top of the chart and in so doing will cast its square aspect to Mercury (27 Leo) and the Ascendant.  While Mars transits to the 10th house are often not that bad and can even be quite constructive, its square aspect to Mercury here looks more malefic and suggests that treasuries will fall further in value which would push yields even higher.  Of course, if yields go higher, stocks become more vulnerable to declines as they often have an inverse relationship.  This relationship is perhaps even more robust these days given the speed with which interest rates have risen in just one year.

While worries over rising yields and inflation could abate once Saturn moves out of range of its opposition to the Sun in the next few weeks, we should note that Saturn is due to station at 13 Aquarius in a close square aspect to the Moon (12 Scorpio) in June.  This suggests that yields will likely spike higher sometime during the May to July period when this Saturn-Moon square is making its closest aspect.  Whether this produces even higher highs in yields is hard to say, but it does look like it will be a significant move higher.

For more details, check out my weekly subscriber newsletter which is published every Sunday.   In addition to reviewing the key planetary and technical influences on US and Indian stocks for the short and medium term, I also provide an astrological analysis of potential upcoming moves in currencies, gold and oil.

These updates are usually posted midweek.  You can be notified of new posts by following me on Twitter.

Photo Credit: Son of Groucho