Tuesday, August 30, 2016

Gold rally faces headwinds from hawkish Fed and Saturn dasha

(30 August 2016) As the global economy sputters along despite massive central bank intervention, gold has had a pretty good year thus far in 2016.  Like most stock markets, gold has benefited from all the QE bond buying and negative interest rates as investors factor in greater inflation risks.  Gold is the traditional hedge against inflation and currency debasement, so it tends to do well when the Fed, the ECB and their fellow travelers are up to their usual money printing tricks to encourage people to spend money they don't have.

The price of gold bottomed in December 2015 at $1050 and has been on the rebound ever since as central banks have become more "creative" in their efforts.  It has been taking a bit of a breather this summer after making an interim high of $1375 in June just after the Brexit vote.  The Fed has been sounding more hawkish lately as more rate hikes are likely on the way.  Can the gold rally continue as the Fed tightens?

Usually, I favour the 1919 London horoscope for the price of gold as this chart represents its first publicly posted price.  But other charts are still useful and can provide additional or confirming information.  One of these is the horoscope for the GLD ETF which is one of the largest ETFs in the world.  GLD was first traded on 18 November 2004.  Instead of having to buy physical gold, ordinary investors can enjoy the benefit of owning gold through purchasing this ETF through the NY stock exchange. 

GLD is designed as a proxy for the price of gold and therefore its variations in price will reflect fluctuations in the price of gold.  Astrologically speaking, we should acknowledge that the changing influences on the GLD horoscope are a second tier sort of influence as it is a derivative of real gold.  Nonetheless, it is such a widely-held security that we would expect the horoscope of GLD to offer at least some meaningful correlation with changes in price.


There are any number of astrological factors one should include in a proper price forecast for any security.  In Vedic astrology, the best starting point for any analysis is the dasha periods.  Indian readers will be more familiar with this sequence of planetary periods where ups and downs of life (and price!) are reflected by the changing planetary lords.  Western readers may not have encountered this concept before, however.  Essentially, a dasha period is a time period of several years where one's fortunes and luck rise or fall depending the nature and condition of the planetary lord of each dasha period.  For example, if a chart of an individual (or asset) is running the 16-year Jupiter dasha period, then good things are more likely to occur.

Each period is then divided into minor dasha periods or bhukties and these can highlight shorter time periods of relative strength or weakness. The twist, however, is that not all Jupiter dasha periods will be positive.  If Jupiter is poorly placed in a horoscope, then things can go sour and prices can fall. Conversely, even the dashas of supposedly bad planets like Saturn can bring gains, happiness and an increase in price if Saturn is strong in the chart.  Alas, astrology is never easy or straight forward.


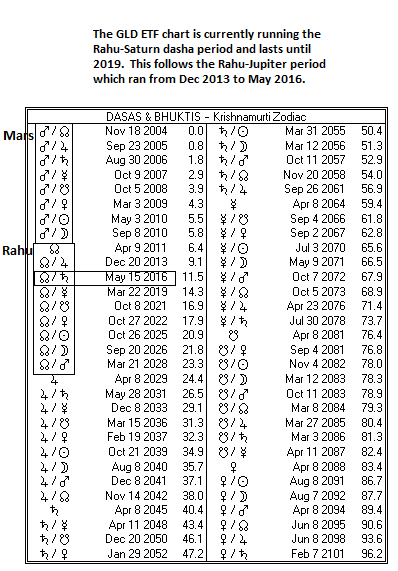
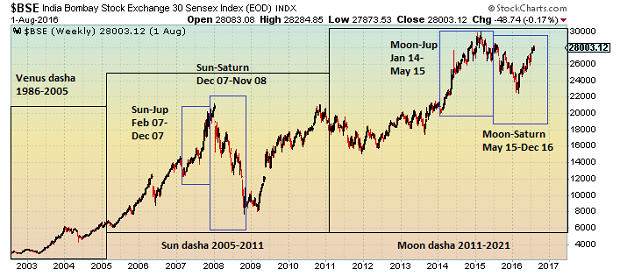
We can see how the dashas in the GLD horoscope may be working in the price chart below.  Since its inception in 2004 until 2011, the GLD chart was running the Mars dasha.  The price of gold rose from about $400 to over $1500 during those seven years.  So a skeptic may well ask: Mars is a malefic planet by nature so how could the price of gold rise four-fold during this time?  The short answer is that Mars is actually quite well placed in the chart.  It is in the 11th house of gains and it is conjunct Ketu and Venus.  Venus is a benefic influence anyway, especially in its own sign of Libra (and hence Mars' dispositor), and Ketu creates a sort of wild card factor.  Ketu is often unpredictable in its effects as it can go either way, often in an exaggerated sense.

If Venus was not in the 11th house also, and Mars was only there with Ketu, then we would not have expected price to rise that much during the Mars dasha period.  In fact, it could have fallen.  An additional positive factor may have been the close 120 degree trine aspect with Uranus (9 Aquarius).  Uranus is like Ketu in that it is an unstable energy which can increase the magnitude of any other influence. Mars was benefiting from the strong Venus influence in the 11th house so both Ketu and Uranus may have acted as multipliers.


When the Mars period ended in 2011, the Rahu period began.  Rahu is the Sanskrit name for the North Lunar Node.  In Vedic astrology, Rahu has a poor reputation.  Like Mars, it is considered to be a malefic influence, although in matters relating to the material world, it is actually more positive than negative.  But Rahu is also quite a porous and receptive planet so whatever influences it is subjected to natally will tend to prevail during its dasha period.  Rahu is fairly neutral in the 5th house in Aries aspected by Mars and Venus.  That's quite mixed but possibly positive.  However, the problem for Rahu in this chart is that it receives a fairly close square aspect from Saturn in the 8th house.  This greatly afflicts the Rahu period in my view, and suggests that prices would be more likely to decline during its period. 

So what has happened so far?  When the first phase of the Rahu period began in April 2011, gold was in the middle of a huge and as it turned out, final rally to its record high of $1920 in September 2011.  Surely that rally disproves the notion that this Rahu period would be negative? Well, not exactly since the Rahu period lasts until 2029!  According to most traditional commentators, Rahu period can bring major gains in the course of its dasha period but they are unlikely to be sustainable by the end of its period.  Rahu is said to give wealth and then takes it away without warning.  Therefore, in the GLD Rahu period, I would think that the Saturn affliction will translate into declines by the end of the dasha period in 2029. 

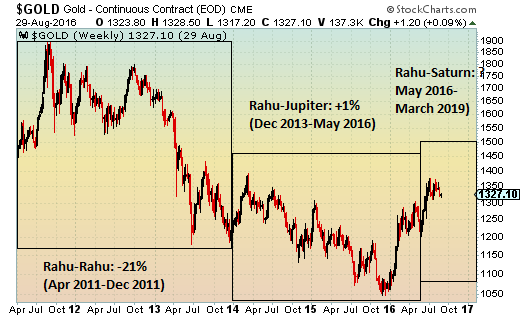
Actually, we can see how this acute Saturn affliction to Rahu played out in the first Rahu-Rahu period from April 2011 to December 2013.  This pure Rahu period saw the price of gold fall from above $1500 to below $1200, a decline of 20%.  This is more or less what we would have predicted beforehand given that difficult Saturn affliction. 

The next minor period was the Rahu-Jupiter period which ran from December 2013 until May 2016.  Gold bounced around somewhat during this time and did make a lower low at 1050.  But by the end of the  period it had recovered and posted a small 1% gain during that 30-month period.  Jupiter, of course, is a benefic planet by nature and it is fairly well placed in the chart in the 10th house in Virgo without significant affliction.  One possible source of weakness is that its dispositor, Mercury (i.e. Jupiter in Virgo) is poorly placed in the 12th house of loss.  We might have thought gold would have performed somewhat better during this Rahu-Jupiter period although at least it did not decline further.  As I mentioned, dashas are not the be-all and end-all of astrological analysis.  Transits, progressions and other measurements also enter into the equation of probable future price trends.

Currently, gold has just started its Rahu-Saturn period.  So what would we expect from this period that runs until March 2019?  Saturn (3 Cancer) is usually a difficult planet and it is badly placed in the 8th house. Moreover, it is even more weakened by the fact that it is close to the equal 8th house cusp at 5 Cancer. The cusps of these dussthana houses are often more problematic for planets and their dasha periods. 

The bottom line is that I would predict that gold will have a difficult time sustaining the current rally by 2019.  While we could see another sudden rally to higher prices at various points along the way, the Rahu-Saturn period looks difficult.  I would think gold will likely decline over the next three years.  How much gold could fall is harder to predict by dashas alone.  And it is not inconceivable that gold could actually post a gain by 2019.  Dashas are powerful but they do not have the final word.  Nonetheless, I would say that the probabilities are such that gold is unlikely to rally back to its 2011 high of $1920 anytime soon.  And it could well fall back to its recent lows of $1050 eventually. 


Weekly Market Forecast

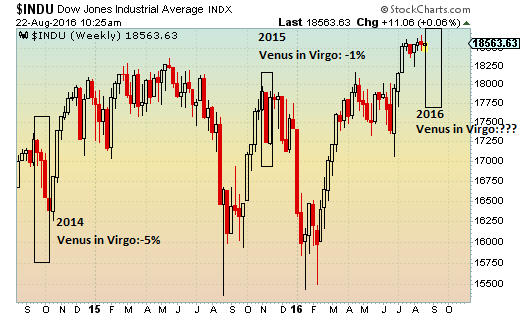
Stocks have been generally weaker before and after the Janet Yellen speech at the Jackson Hole conference on Friday.  We have seen some gains so far this week although US stocks are lower in Tuesday's trade.  This relative weakness is in keeping with expectations as I thought the downside risk increased around the entry of Venus into Virgo last Thursday the 25th.

More downside looks fairly likely this week as Mars squares Rahu for the first half of the week and then the Moon conjoins the Sun and Rahu on the day of the Solar Eclipse on Thursday. The key US jobs report that could signal the next Fed rate hike comes out Friday just as the Moon enters Virgo to join Jupiter, Mercury and Venus.  That looks positive and could reflect strength in the job market which could create some turbulence for some stocks as rates would be more likely to rise.  At the same time, however, the alignment of positive planets in Virgo could also signify optimism in the market which may coincide with gains.  I tend to think the market is more vulnerable here as Virgo contains a debilitated planet in Venus which could upend the otherwise positive vibes.  We shall see.

Monday, August 22, 2016

Markets await Yellen at Jackson Hole as Venus enters Virgo

(22 August 2016)  Financial markets are anxiously awaiting Friday's Jackson Hole speech from Fed Chair Janet Yellen.  Her annual presentation at the economic symposium at Jackson Hole, Wyoming often clarifies Federal Reserve policy for the coming months.  This year many Fed watchers are wondering if the famously dovish Yellen will make a stronger case for another rate hike in the near term, possibly in September.   If she does signal higher rates sooner rather than later or delivers some other surprises, stocks are more likely to fall.  Despite modest improvement in US fundamentals recently, the market may not like the sound of higher rates after enjoying the fruits of the near-zero interest rate policy over the past seven years.  The Fed's near-zero interest rate policy has increasingly been criticized as the main reason for growing economic inequality in the US and why the record high stock market is now so widely divergent from the real economy.

Stocks have been going mostly sideways so far in August.  In the first two weeks of August, the Jupiter-Uranus alignment and simultaneous entry of Jupiter into sidereal Virgo kept sentiment fairly positive.  As I suggested in my previous market forecast, we have seen more weakness in recent days, however, as the apparent Jupiter influences begin to wane.  As Jupiter moves away from its angular alignment with Uranus, there is a greater risk of declines as the bearish Saturn influence may manifest more readily.  Mars exactly conjoins Saturn on Tuesday and this may well be an important turning point in financial markets as both malefic planets will then form a larger alignment with Neptune and the North Lunar Node (Rahu).  Multi-planet alignments involving malefics like Saturn are more often correlated with stock declines.  This square alignment of Saturn, Neptune and Rahu involves slow moving planets and will be roughly in effect until October. 

Sentiment may also suffer another hit this week as Venus enters sidereal Virgo.  The transit of Venus through its sign of debilitation occurs once a year and lasts about four weeks.   It usually correlates with weakness in stocks.  Venus enters Virgo on Thursday 25th August and will stay there until Sunday 18th September.  Venus symbolizes money and value (among other things) and when it transits through Virgo, these positive qualities cannot come forth so readily.  As a result, value is undermined and stocks typically fall.  This is a simple yet effective correlation in financial astrology with a good track record as the tables below show and previous financial astrology posts have highlighted.   While I have calculated the declines for US stocks, the correlation seems to hold across most global stock markets.  Last year's transit of Venus through Virgo brought only a very modest 1% fall, although the deepest decline in the middle the transit was a more significant 4%.


                    MARKET EFFECTS OF VENUS TRANSITS OF SIDEREAL VIRGO

  Year   Venus entry
   Venus exit
 Outcome-US
  2009  October 9  November 2        -4%
  2010  July 31  August 31        -6%
  2011  September 9  October 3        -6%
  2012  October 22  November 16        -7%
  2013  August 11  September 5        -3%
  2014  September 24  October 18        -5%
  2015  November 3  November 29        -1%
  2016  August 25  September 18        ???


It is intriguing then that Venus should enter Virgo just one day before Yellen's major speech.  It doesn't necessary mean that Yellen will talk up the prospect of tightening rates although the symbolism would tend to suggest some constraint or limitation (Virgo) on value and money (Venus).  Indeed, the bearish Venus-in-Virgo effect could result from some other source altogether.  And yet recent statements by fellow Fed members have sounded more hawkish (i.e. more in favour of tightening) so that outcome is perhaps more likely given this Venus influence.


This week contains an unusually high density of close aspects, both bullish and bearish.  The Mars-Saturn conjunction should be seen as a negative although it needn't manifest on the day of its exact conjunction on Tuesday.  The Mercury-Jupiter conjunction still aligns with Uranus and Venus will join them in Virgo later in the week.  The negative Virgo influence notwithstanding, those three planets are all benefic and hence the alignment should produce some temporary upside.   It is important to note that any negative effects of the Venus in Virgo may not even manifest this week.  For this reason, it is also conceivable that the market could react favourably to Yellen's speech at Jackson Hole. 


Tuesday, August 9, 2016

Stocks flying high as Jupiter enters Virgo

(9 August 2016)  Stock markets are still flying high this week as the summer rally continues apace.  This Panglossian state of affairs is largely the result of the efforts of the world's central bankers who are committed to buy as much debt and other assets as possible as they bravely attempt to stimulate economic activity.  This strategy hasn't worked very well over the past seven years but that is not stopping them for digging the debt hole even larger.  There is a belief in some quarters that central banks can't fix the economy and all they can do is postpone the collapse of the financial system for a while.

The buoyant mood may be partially attributable to the prominence of Jupiter and Uranus in the sky at the present time.  Jupiter and Uranus form a near-exact 150-degree alignment this week just as Jupiter enters the sign of sidereal Virgo on Thursday the 11th.  Jupiter is bullish, of course, so this is a double shot of Jupiterian optimism as the Uranian influence often magnifies its bullish effects.  However, it is unclear how long this state of contentment can last.  Uranus is now retrograde and hence will be separating from its alignment with Jupiter after this week.  That could let some air out of the financial balloon as time goes on.

Jupiter's entry into a new sign is often bullish for a few days although other factors can offset this effect.  Jupiter changes signs about once every 12 months.  In July 2015 it made its previous sign change as it entered Leo.  Most global stocks rose around 5% in the 10-day window around this Jupiter sign change.  Using the Krishnamurthi ayanamsha, Jupiter entered Leo on 13th July 2015.  We can take the last degree of Cancer and the first degree of Leo as the effective range of its influence (I admit it is somewhat arbitrary but it's plausible enough).  These two degrees of arc take Jupiter about 10 days to traverse when it is going at its normal forward velocity. 

The preceding Jupiter ingress into Cancer occurred on 19th June 2014.  Stocks also rose during this 10-day window although a more modest 2%. 

Jupiter entered Gemini on 30th May 2013.  But in this ingress, stocks actually fell by 1% during the 10-day window straddling the ingress.  Other factors such as the Saturn-Neptune alignment may have neutralized any upside from Jupiter. 

Stocks also fell in the previous two Jupiter ingresses in May 2012 and May 2011.  In both of these sign changes, Jupiter was closely aligned with a malefic planet.  In 2012, it was exactly aligned with Saturn as it entered Taurus.  In 2011, it was aspected by Rahu (North Lunar Node) as it entered Aries. 


The moral of the story is that, by itself, a Jupiter ingress may be positive for sentiment but it can be offset if negative factors occur at the same time.  This time around there are no apparent negative influences on Jupiter during its ingress window from 6th August to 15th August.  The ongoing Mars-Saturn conjunction is more problematic, however, and it is slowly getting closer.  But I suspect it may not quite be ready to manifest its negativity.  So that is an argument for stocks moving higher or at least remaining near these lofty levels for a few more days.

To be sure, I had thought we might have seen more troubles from the ongoing Mars-Saturn conjunction in Scorpio.  This has been ongoing since early July but so far it has had no obvious effect.  The conjunction is closer now, however, and is due to be exact on 23rd August.  That could be something to watch for down the road as the conjunction will be ongoing until mid-September.

For more details and analysis on market trends for this week, this month and this year, please check out my weekly MVA Investor Newsletter.  The newsletter is published every Saturday and includes extended discussion of US and Indian stock markets, as well as gold, oil and major currencies.

Tuesday, August 2, 2016

How sustainable is the Indian stock market rally? Dashas and financial astrology

(2 August 2016) 2016 has been a good year so far for Indian stocks.  After bottoming out in January and February, stocks have rebounded strongly as the benchmark BSE-Sensex is now 25% above its recent lows.  It is now just 6% away from matching its all-time high of 30,000 set in early 2015.  Part of the explanation for the rally has been relative weakness in the US Dollar which has encouraged more international capital to flow into emerging markets.  The domestic scene has also been favourable as corporate earnings have been strong and the Modi government has proceeded apace with reforms such as the GST.   But how long can it last? 

A brief overview of the dasha periods for the BSE-Sensex horoscope suggests the rally is more likely to falter fairly soon.  In my experience, dashas are one useful tool among many for analyzing longer term trends over months and years.  They are often not decisive for anything shorter than that, and indeed they often give unclear results when the indications are mixed.  And a mixed outcome is more often the case since planets may not be clearly negative or positive.  That is why the financial astrologer -- and all astrologers -- need to refer to other factors to create a comprehensive picture.  Transits, progressions, varshphal (returns) are just a few of the other techniques that we can use when forecasting price trends of different lengths. 

But dashas are uniquely suited to charting long term trends.  Dashas themselves last anywhere from six years in the case of the Sun dasha to twenty years for Venus.   These major dasha periods are further divided into minor periods or bhukties.  Both major and minor dasha periods can provide important clues about possible trends depending on 1) the dasha lord's intrinsic nature and 2) the lord's condition in the chart.  When both are strong, stocks are more likely to rise.  When both are weak and afflicted, then stocks are more likely to fall.  If there is a blending of influences as is often the case, then there may be a lack of clear direction.  Or least, we can say that dasha analysis does not provide decisive information of the probable direction of the market and other factors should be used to provide more useful insights. 


The BSE-Sensex has definitely enjoyed a very nice long term trend as it has risen from under 1000 since its inception on 1 January 1986 to over 28,000 today.  The Sensex was launched under the Venus dasha which was very auspicious since Venus is considered a benefic planet that promotes gains.  The condition of Venus in the chart is somewhat mixed, however.  On the plus side, it rules good houses, the 5th/Taurus and the 10th/Libra.  However, it is placed in the 12th house (loss!) with the Sun and Neptune.  While some astrologers would see a 12th house placement as a kiss of death, I don't in this case because Venus (12 Sagittarius) is very far from the equal 12th house cusp at 28 Sagittarius (N.B.  I use equal house cusps and whole sign houses.  When the Ascendant is 28 degrees of Capricorn, all the house cusps are at 28 degrees).  The other saving grace here is that Venus is disposited by Jupiter which is very strongly placed a few degrees from the Ascendant.  Yes, it's debilitated, but in my experience debilitation is overrated in its negative impact by most astrologers. 

On balance, I would expect a Venus dasha period to coincide with significant gains.  And that's exactly what happened.  Stocks rose more than six-fold from under 1000 in 1986 to over 6000 in 2005 by the end of the Venus dasha. 

The Sun dasha follows the Venus dasha and ran from February 2005 to February 2011.  The Sun is considered a fairly neutral planet by Vedic principles but it can become benefic if it is well aspected or malefic is poorly placed.  I think it is more benefic here as the Sun benefits from its conjunction with Venus (benefic) and Neptune (neutral).  Neptune is neutral when in conjunction but it takes on a more positive influence when surrounded by benefics such as Venus.  To be sure, the Sun is also back in the 12th house but again it is not that close to the cusp so I would say it escapes the worst of it.  And it is again disposited by that super-strong Jupiter on the Ascendant.  I would expect the Sun dasha to be somewhat positive, even if not quite as positive as Venus.


We can see that the Sensex rose three-fold during the Sun dasha from 6000 to 18,000.  That's pretty nice, especially since it occurred over just six years.  On a percentage basis, it was actually more bullish than the Venus  dasha period was.  But where things get really interesting is when you look at the trends in the minor periods.  As a window to see how dashas are working, I have found the most telling differences occur between Jupiter and Saturn.  And as it happens, they just happen to follow each other in the Vimshottari dasha sequence. 

Jupiter is the bullish planet par excellence, while Saturn is quintessentially bearish.  Jupiter is very strong in the Sensex horoscope as it is rising near the Ascendant, its debilitation in Capricorn notwithstanding.  Saturn actually isn't that badly placed either, as it is in the 11th house in Scorpio, unafflicted.  It may actually get a bit of a boost from the wide conjunction with Mercury and Uranus.  But on the other hand, it is disposited by Mars which is in trouble in the 10th house conjunct grim Pluto and ethereal Ketu.  Even if we considered these temporary chart influences to be somehow neutral and "mixed", Saturn is still Saturn by nature and therefore bearish.

During the brief 11-month Sun-Jupiter dasha period from Feb 2007 to Dec 2007, the Sensex jumped 8000 points (65%).  And that is why they call Jupiter a bullish planet!  The end of the Sun-Jupiter period closely coincided with the pre-crash top of the market which occurred just a few weeks later in early January.  The Sun-Saturn period then ran from December 2007 to November 2008.  This exactly corresponded with the global meltdown of the Great Recession.   Indian stocks fell from a high of 20,000 to just 8000 during this Sun-Saturn period, a decline of 60%.  Rule #1 in financial astrology is: bullish Jupiter gives, and bearish Saturn takes away. 


The Moon dasha period followed the Sun period.  The Moon period began in late 2011 and will run until 2021.  So far, it has been good for stocks as the Sensex has risen from 18,000 to 28,000 currently.  The Moon looks problematic, however.  It is benefic by nature, especially if waxing or at least fairly bright (near full) as is the case here.  But it receives a square aspect from pessimistic Saturn and a trine aspect from disruptive Rahu.  Both are unhelpful.  Also the Moon is placed in the 8th house, albeit not very close to the cusp.  It is hard to be optimistic about the Moon dasha period.  While I would not say gains cannot occur during its 10-year period, they seem less likely.

Again, the more telling distinctions arise in the differences between the Jupiter and Saturn minor periods.  The Moon-Jupiter dasha coincided with the big Modi election rally in 2014.  Stocks rose from 20,000 to 28,000 by the end of the Moon-Jupiter period in May 2015.  The all-time high of 30,000 also occurred during this bullish dasha period. But after the Moon-Saturn dasha began, stocks fell throughout 2015 before bottoming in early 2016 at 22,000.   The Sensex was at about 28,000 at the beginning of the Moon-Saturn period and has now virtually climbed all the way back to that level. 

Can it move higher during this apparently bearish Moon-Saturn dasha period?  It's certainly possible and it wouldn't shock me given the margin of error involved in dasha interpretation.  But I would still say the cosmic dice are loaded against this Moon-Saturn period finishing in the green above 28,000.  Since both the Moon and Saturn are problematic in terms of their influences, it seems more likely that stocks will finish this period lower rather than higher.  How much lower is hard to say based on dasha periods alone. 

The subsequent Mercury period that begins in December looks more positive and will run until 2018.  While the previous Sun-Mercury period (Nov 2008-Sep 2009) was very bullish indeed, this Moon-Mercury period may not be as positive owing to the afflictions to the Moon.  Nonetheless, Mercury's mostly positive condition in the 11th house with Uranus should produce some sizable rallies, even if they are not as strong as in 2009 or as sustainable.  We shall see.


Weekly Market Forecast

Stocks have suffered modest losses early this week as the Bank of Japan disappointed liquidity-addicted investors today with a limited stimulus package.  In New York, the Dow is still trading above 18,200 as I write, although it did hold up fairly well last week.  European markets are also down in Tuesday trading, with Indian stocks only slightly lower as the Sensex slipped below 28,000 in Tuesday's close.  This mildly bearish outcome was in keeping with expectations as I thought we could see some downside late last week and early this week.  In last week's market forecast I thought we could see more downside last week, however, although it seems as if investors are now feeling the approaching Mercury-Saturn square. 

I think stocks are vulnerable to more declines this week as the Mercury-Saturn square tightens.  This could be felt more on Thursday or Friday given the additional Moon influence on those days.  Thursday looks more bearish than Friday, however.  Early next week could bring more downside as Mercury conjoins Rahu (North Lunar Node).

For more details and analysis on market trends for this week, this month and this year, please check out my weekly MVA Investor Newsletter.  The newsletter is published every Saturday and includes extended discussion of US and Indian stock markets, as well as gold, oil and major currencies.