 (2 August 2016)
2016 has been a good year so far for Indian stocks. After bottoming
out in January and February, stocks have rebounded strongly as the
benchmark BSE-Sensex is now 25% above its recent lows. It is now just
6% away from matching its all-time high of 30,000 set in early 2015.
Part of the explanation for the rally has been relative weakness in the
US Dollar which has encouraged more international capital to flow into
emerging markets. The domestic scene has also been favourable as
corporate earnings have been strong and the Modi government has
proceeded apace with reforms such as the GST. But how long can it
last?
(2 August 2016)
2016 has been a good year so far for Indian stocks. After bottoming
out in January and February, stocks have rebounded strongly as the
benchmark BSE-Sensex is now 25% above its recent lows. It is now just
6% away from matching its all-time high of 30,000 set in early 2015.
Part of the explanation for the rally has been relative weakness in the
US Dollar which has encouraged more international capital to flow into
emerging markets. The domestic scene has also been favourable as
corporate earnings have been strong and the Modi government has
proceeded apace with reforms such as the GST. But how long can it
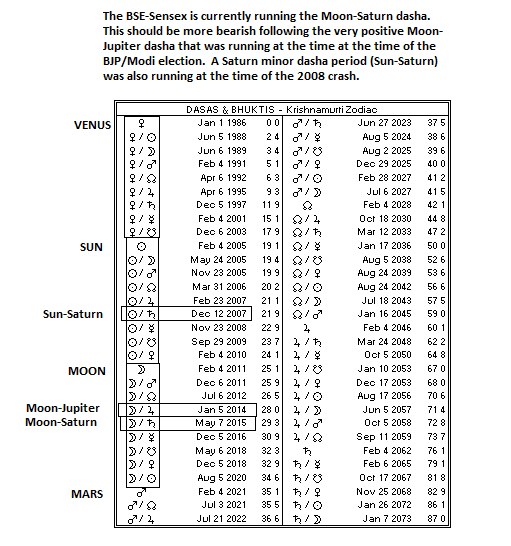
last? A brief overview of the dasha periods for the BSE-Sensex horoscope suggests the rally is more likely to falter fairly soon. In my experience, dashas are one useful tool among many for analyzing longer term trends over months and years. They are often not decisive for anything shorter than that, and indeed they often give unclear results when the indications are mixed. And a mixed outcome is more often the case since planets may not be clearly negative or positive. That is why the financial astrologer -- and all astrologers -- need to refer to other factors to create a comprehensive picture. Transits, progressions, varshphal (returns) are just a few of the other techniques that we can use when forecasting price trends of different lengths.
But dashas are uniquely suited to charting long term trends. Dashas themselves last anywhere from six years in the case of the Sun dasha to twenty years for Venus. These major dasha periods are further divided into minor periods or bhukties. Both major and minor dasha periods can provide important clues about possible trends depending on 1) the dasha lord's intrinsic nature and 2) the lord's condition in the chart. When both are strong, stocks are more likely to rise. When both are weak and afflicted, then stocks are more likely to fall. If there is a blending of influences as is often the case, then there may be a lack of clear direction. Or least, we can say that dasha analysis does not provide decisive information of the probable direction of the market and other factors should be used to provide more useful insights.
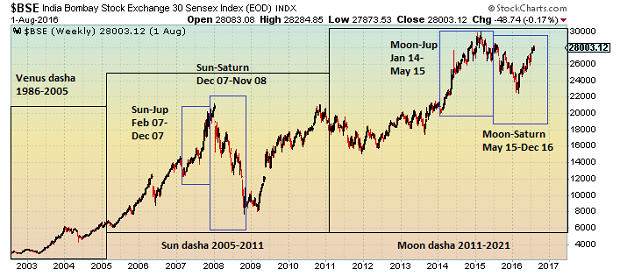
The BSE-Sensex has definitely enjoyed a very nice long term trend as it has risen from under 1000 since its inception on 1 January 1986 to over 28,000 today. The Sensex was launched under the Venus dasha which was very auspicious since Venus is considered a benefic planet that promotes gains. The condition of Venus in the chart is somewhat mixed, however. On the plus side, it rules good houses, the 5th/Taurus and the 10th/Libra. However, it is placed in the 12th house (loss!) with the Sun and Neptune. While some astrologers would see a 12th house placement as a kiss of death, I don't in this case because Venus (12 Sagittarius) is very far from the equal 12th house cusp at 28 Sagittarius (N.B. I use equal house cusps and whole sign houses. When the Ascendant is 28 degrees of Capricorn, all the house cusps are at 28 degrees). The other saving grace here is that Venus is disposited by Jupiter which is very strongly placed a few degrees from the Ascendant. Yes, it's debilitated, but in my experience debilitation is overrated in its negative impact by most astrologers.
On balance, I would expect a Venus dasha period to coincide with significant gains. And that's exactly what happened. Stocks rose more than six-fold from under 1000 in 1986 to over 6000 in 2005 by the end of the Venus dasha.
The Sun dasha follows the Venus dasha and ran from February 2005 to February 2011. The Sun is considered a fairly neutral planet by Vedic principles but it can become benefic if it is well aspected or malefic is poorly placed. I think it is more benefic here as the Sun benefits from its conjunction with Venus (benefic) and Neptune (neutral). Neptune is neutral when in conjunction but it takes on a more positive influence when surrounded by benefics such as Venus. To be sure, the Sun is also back in the 12th house but again it is not that close to the cusp so I would say it escapes the worst of it. And it is again disposited by that super-strong Jupiter on the Ascendant. I would expect the Sun dasha to be somewhat positive, even if not quite as positive as Venus.
We can see that the Sensex rose three-fold during the Sun dasha from 6000 to 18,000. That's pretty nice, especially since it occurred over just six years. On a percentage basis, it was actually more bullish than the Venus dasha period was. But where things get really interesting is when you look at the trends in the minor periods. As a window to see how dashas are working, I have found the most telling differences occur between Jupiter and Saturn. And as it happens, they just happen to follow each other in the Vimshottari dasha sequence.
Jupiter is the bullish planet par excellence, while Saturn is quintessentially bearish. Jupiter is very strong in the Sensex horoscope as it is rising near the Ascendant, its debilitation in Capricorn notwithstanding. Saturn actually isn't that badly placed either, as it is in the 11th house in Scorpio, unafflicted. It may actually get a bit of a boost from the wide conjunction with Mercury and Uranus. But on the other hand, it is disposited by Mars which is in trouble in the 10th house conjunct grim Pluto and ethereal Ketu. Even if we considered these temporary chart influences to be somehow neutral and "mixed", Saturn is still Saturn by nature and therefore bearish.
During the brief 11-month Sun-Jupiter dasha period from Feb 2007 to Dec 2007, the Sensex jumped 8000 points (65%). And that is why they call Jupiter a bullish planet! The end of the Sun-Jupiter period closely coincided with the pre-crash top of the market which occurred just a few weeks later in early January. The Sun-Saturn period then ran from December 2007 to November 2008. This exactly corresponded with the global meltdown of the Great Recession. Indian stocks fell from a high of 20,000 to just 8000 during this Sun-Saturn period, a decline of 60%. Rule #1 in financial astrology is: bullish Jupiter gives, and bearish Saturn takes away.
The Moon dasha period followed the Sun period. The Moon period began in late 2011 and will run until 2021. So far, it has been good for stocks as the Sensex has risen from 18,000 to 28,000 currently. The Moon looks problematic, however. It is benefic by nature, especially if waxing or at least fairly bright (near full) as is the case here. But it receives a square aspect from pessimistic Saturn and a trine aspect from disruptive Rahu. Both are unhelpful. Also the Moon is placed in the 8th house, albeit not very close to the cusp. It is hard to be optimistic about the Moon dasha period. While I would not say gains cannot occur during its 10-year period, they seem less likely.
Again, the more telling distinctions arise in the differences between the Jupiter and Saturn minor periods. The Moon-Jupiter dasha coincided with the big Modi election rally in 2014. Stocks rose from 20,000 to 28,000 by the end of the Moon-Jupiter period in May 2015. The all-time high of 30,000 also occurred during this bullish dasha period. But after the Moon-Saturn dasha began, stocks fell throughout 2015 before bottoming in early 2016 at 22,000. The Sensex was at about 28,000 at the beginning of the Moon-Saturn period and has now virtually climbed all the way back to that level.
Can it move higher during this apparently bearish Moon-Saturn dasha period? It's certainly possible and it wouldn't shock me given the margin of error involved in dasha interpretation. But I would still say the cosmic dice are loaded against this Moon-Saturn period finishing in the green above 28,000. Since both the Moon and Saturn are problematic in terms of their influences, it seems more likely that stocks will finish this period lower rather than higher. How much lower is hard to say based on dasha periods alone.
The subsequent Mercury period that begins in December looks more positive and will run until 2018. While the previous Sun-Mercury period (Nov 2008-Sep 2009) was very bullish indeed, this Moon-Mercury period may not be as positive owing to the afflictions to the Moon. Nonetheless, Mercury's mostly positive condition in the 11th house with Uranus should produce some sizable rallies, even if they are not as strong as in 2009 or as sustainable. We shall see.
Weekly Market Forecast
Stocks have suffered modest losses early this week as the Bank of Japan disappointed liquidity-addicted investors today with a limited stimulus package. In New York, the Dow is still trading above 18,200 as I write, although it did hold up fairly well last week. European markets are also down in Tuesday trading, with Indian stocks only slightly lower as the Sensex slipped below 28,000 in Tuesday's close. This mildly bearish outcome was in keeping with expectations as I thought we could see some downside late last week and early this week. In last week's market forecast I thought we could see more downside last week, however, although it seems as if investors are now feeling the approaching Mercury-Saturn square.
I think stocks are vulnerable to more declines this week as the Mercury-Saturn square tightens. This could be felt more on Thursday or Friday given the additional Moon influence on those days. Thursday looks more bearish than Friday, however. Early next week could bring more downside as Mercury conjoins Rahu (North Lunar Node).
For more details and analysis on market trends for this week, this month and this year, please check out my weekly MVA Investor Newsletter. The newsletter is published every Saturday and includes extended discussion of US and Indian stock markets, as well as gold, oil and major currencies.