 (21 September 2017)
The Bitcoin roller coaster took another wild turn this week as the
cryptocurrency gained more than 10% and moved back to $4000 USD. It's
been a volatile year for Bitcoin which has skyrocketed from in value
from less than $1000 in February to a high of $5000 on 1st September.
While it is designed to replace government-issued fiat currencies, it's
current claim to fame is as a vehicle for speculation.
(21 September 2017)
The Bitcoin roller coaster took another wild turn this week as the
cryptocurrency gained more than 10% and moved back to $4000 USD. It's
been a volatile year for Bitcoin which has skyrocketed from in value
from less than $1000 in February to a high of $5000 on 1st September.
While it is designed to replace government-issued fiat currencies, it's
current claim to fame is as a vehicle for speculation. Is Bitcoin a tulip-like bubble waiting to burst, the wave of the future that can only climb higher in value, or something in between? After the Chinese government shut down its bitcoin exchange, there are more questions about its viability as other governments could also move to prevent competition from this unregulated upstart cryptocurrency.
I've been meaning to post something on Bitcoin for the past couple of months. However, I have run into difficulty finding a workable horoscope that seemed to accurately reflect some of the recent price moves. In my only other post on Bitcoin back in December 2013, I used the "Genesis Block" which marked the founding of the blockchain technology on 3 January 2009. It seemed to work fairly well at that time, although there was less price fluctuation to use as data points. Using this inception chart, I predicted that Bitcoin might be more susceptible to declines in 2014 and 2015. This proved to be largely correct as it declined from a high of $1000 to about $230 in late 2015. But that could have been just a coincidence.
I'm less convinced now that 3 January blockchain chart is entirely reliable. It may represent some element of Bitcoin such as the technology itself and perhaps part of its value, but it is not doing a good job of reflecting this year's price movements. Recently, I am thinking that the first trade chart may be more useful.
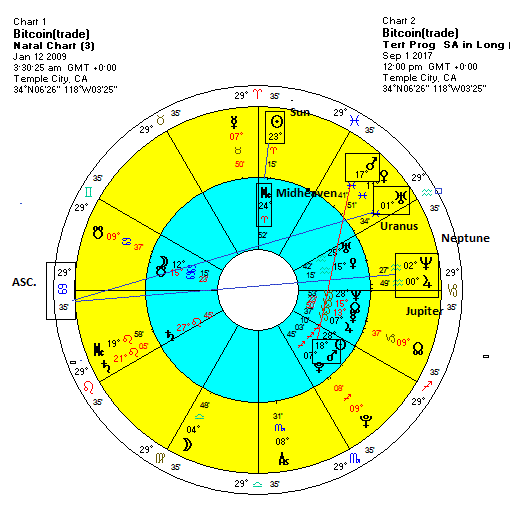
At 3:30 am GMT on 12 January 2009, the mysterious unknown founder of Bitcoin, Satoshi Nakamoto, conducted a transaction with his collaborator, Hal Finney. One problem with this chart and most others to do with Bitcoin is assigning a specific place, or "place of birth". Nakamoto's identity is still unknown to this day and it is therefore also unknown where he first invented the blockchain technology. At the time of the first transaction, Hal Finney was living in the Los Angeles suburb of Temple City, CA so that is my working chart for now. At least he received the bitcoin at that location, no matter where it was sent from.
As I see it, a workable Bitcoin horoscope needs to provide clear answers to the following questions.
1) Why has the value of Bitcoin risen by five-fold so far during 2017?
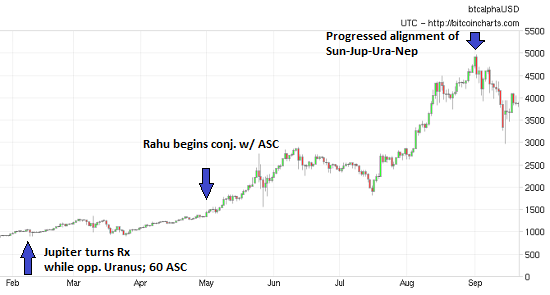
On the first question, I think the parabolic rally in 2017 is due in part to the stationary conjunction of Rahu (North Lunar Node) to the Ascendant at 29 Cancer over the past few months. Rahu is the planet of instability and change and when it is prominent in a financial horoscope, it often describes periods of sharp price appreciation. Rahu was probably more likely to mark a strong gain because of its very favourable placement in the natal chart in between benefics Mercury and Jupiter in the 7th house in Capricorn. Rahu has been within five degrees of the Ascendant since May 2017 and that accounts for a largest portion of the current rally as it pushed above previous highs of $1500.
Back in February near the start of the rally, Jupiter, the planet of optimism, increase and expansion, stationed retrograde at 29 Virgo, exactly in a 60 degree alignment with the Ascendant. It also exactly aspected the natal Neptune by 120 degree trine aspect. In so doing, Jupiter also aligned very closely with Uranus (27 Pisces), the planet of sudden changes, and this created a symbiotic effect which resonated with the Ascendant in late Cancer. The twin bullish influences of Jupiter and Uranus therefore began in early 2017 right around the time that the Bitcoin rally gathered steam.
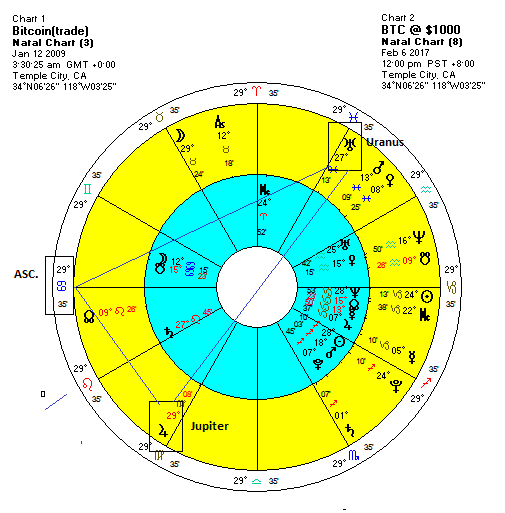
Moreover, the tertiary progression alignment of Jupiter, Neptune, Uranus and the Sun was very bullish for much of this year as they aligned with the Ascendant. Also, Jupiter and the Sun are currently forming a mundane square where Jupiter aligns with the Ascendant (by 180 degree aspect) and the Sun aligns with the Midheaven by conjunction. Taken together, these are powerful alignments that can last for months and can coincide with major price increases.
2) Why did Bitcoin peak on 1st September and then undergo a 40% pullback until 15 September?
This is a trickier question. First, Saturn stationed at 27 Scorpio a few days beforehand on 25 August. This formed a close alignment with Rahu and the Ascendant within a few degrees. Also Saturn's dispositor, Mars, entered Leo a day later, on 26 August. Mars in Leo casts a full-strength square aspect to Saturn in Scorpio, so that may have damaged sentiment somewhat as Mars began its transit through Leo.
We should also note that Venus conjoined the Moon and opposed Mercury right on 1 September. Venus is a bullish influence and so it is not surprising that it's double positive influence could have marked a temporary high point in the price. The Venus transit is very short-lived and only lasts a couple of days.
By this time, transiting Jupiter (28 Virgo) had basically returned to its position of its retrograde station (29 Virgo) near the start of the rally in February. Once Jupiter had moved past this point in late Virgo, it is possible that it was exerting less of a bullish influence. This is a somewhat idiosyncratic explanation but it is nonetheless intriguing. Jupiter's bullish influence would likely be strongest when it was in close alignment with the Ascendant.
Also tertiary progressed Mars formed a near-exact square aspect with natal Mars in September. Mars-to-Mars aspects are usually bearish and often coincide with declines. While it is difficult to pinpoint the precise time window for this negative influence, it seems likely it would occur sometime in the August to October period. The Mars progression therefore might have undermined whatever positive influences may have been in play.
3) Why has Bitcoin rebounded since its 15 September low below $3000?
One reason would be that transiting Venus conjoined Rahu and the Ascendant on 15 September. This was a bullish influence as Venus entered the 1st house for the next several weeks, other transits and progressions notwithstanding. Also, the interim low to $3000 coincided with the Sun's conjunction to Saturn, which in turn highlighted the Saturn-to-Saturn square aspect. Once the Sun had passed Saturn at 27 Leo on 15 September, there may have been less negativity.
The Outlook for Bitcoin
The clearest influence in the coming days appears to be the Venus-Mars conjunction which will align with natal Saturn in October. This looks like a bearish influence generally, although other offsetting positive influences are still possible between now and then. Nonetheless, I would think it would be difficult for the Bitcoin price to suddenly resume its upward march in the near term. The period around the exact Mars-Saturn square on 9 October would seem to have greater downward potential. It's even possible we could see Bitcoin retest its September lows of $3000 sometime in October. But November should bring some gains and that could be enough to reverse any possible down trend.
Another possible source of uncertainty is that the chart begins its Mercury-Ketu period on 24 September which is run for the next year until 22 September 2018. While major dasha lord Mercury is a bullish influence, especially in this chart since it is stationary, Ketu is more of a wild card and contains increased downside risk. Ketu is still quite strong in the Bitcoin horoscope since it is conjunct 1st lord Moon and aspected by benefics Mercury and Jupiter. But we should regard the Ketu minor period as a somewhat more bearish background influence than we have seen recently during the previous Mercury-Mercury dasha period.
So let's see how this first trade chart operates here in terms of accounting for upcoming price fluctuations. It's early days yet but so far it seems to do a fairly good job. More declines into October would definitely increase my belief that it is a workable chart for BTC.
Weekly Market Forecast
Stocks remain at or near all-time highs after the latest statement yesterday from the Federal Reserve. Chair Janet Yellen kept interest rates unchanged but she remains committed to raising them further over the next two years. She also announced that the Fed would begin to sell its QE assets starting next month. The Dow is trading around 22,400 today while gold has again fallen below $1300 on the somewhat hawkish Fed stance. The Indian Sensex is similarly bullish as it is trading at its highs of 32,300.
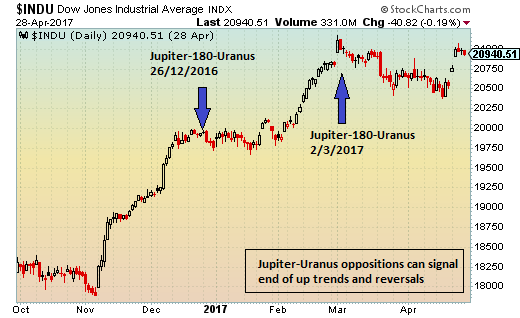
The outlook for the next week is more uncertain as Jupiter aligns exactly with Uranus on 27 September. As I noted last week, this opposition aspect between two bullish planets can sometimes mark interim highs in the market. And with Saturn approaching its bearish alignment with Rahu (North Lunar Node) in early October, it may become more difficult for stocks to keep the rally going much longer.
For more details and analysis on market trends for this week, this month and this year, please check out my weekly MVA Investor Newsletter. The newsletter is published every Saturday and includes extended discussion of US and Indian stock markets, as well as gold, oil and major currencies.