Monday, February 15, 2016

Research in financial astrology: Mars in Scorpio

(15 February 2016) Financial markets remained turbulent last week as Fed Chair Janet Yellen did not backtrack on her plan to hike interest rates further in 2016.  Investors had hoped that the usually dovish Ms. Yellen might have been more reassuring about the reduced likelihood of further hikes given the current sorry state of the global economy.  At the same time, she did suggest that the Fed might consider bringing negative interest rates to the US if circumstances demanded it.  While some investors saw this as an olive branch to the markets, others were scared off with the hint that this latest unproven central bank experiment might actually be put into practice in the US.

Despite a rebound Friday, the Dow finished down more than 1% on the week at 15,973.  Indian stocks fell more sharply as the Sensex ended the week at 22,986.  Indian stocks have now given up all the gains in the post-Modi election rally from May 2014. Not surprisingly, gold also enjoyed a strong gain to $1263 as the Venus-Jupiter aspect tightly activated the 1919 gold horoscope as discussed in last week's post.

In last week's market forecast, I had thought we might have seen more gains on the midweek Venus-Jupiter alignment.  We did see strong gains in Europe on Wednesday but the positive vibes eventually petered out during the US session as intraday gains disappeared by the close.  Stocks became more bearish after Venus began to separate from Jupiter on Thursday. 

While we could see Friday's optimism continue into this week, the broader picture still looks challenging for the next several weeks.  As I have discussed previously, the ongoing Jupiter-Rahu conjunction has been a negative influence on markets since December and could well depress prices until it ends in mid-March.  Or rather, its first conjunction is due to end in mid-March since Jupiter's current retrograde period means that it will form a second conjunction with Rahu (North Lunar Node) that will last from May through to July.


Mars in Scorpio: Principles in financial astrology


But we should also take note of another ongoing influence that could move markets in the near term: the transit of Mars through the sign of Scorpio.  Mars enters sidereal Scorpio this Saturday, 20th February and will remain there until 18th June.  This is an unusually long transit of Scorpio because Mars will turn retrograde in April and then retrace its path through Scorpio.  It will briefly move out of Scorpio into the last degree of Libra for a few weeks in June-July but it will again move through Scorpio from 11th July to 17th September.   And please note, this is sidereal Scorpio I'm referring to here as used in Indian astrology (i.e. "Jyotish").  The Western tropical zodiac is now offset 24 degrees from its sidereal counterpart and does not follow the correlation I am advancing here.

One of the basic principles of financial astrology is that some planets are negative by nature.  When they are aligned with other planets or otherwise strong, they tend to damage sentiment and therefore are correlated with declines.  Due to its low velocity, Saturn is the most dominant negative planet, but Mars is also usually bearish in its effects.  Because it moves fairly quickly, however (0.6 degrees/day), its effects may only last for a day or two as it forms aspects with other planets.


But what happens when Mars transits through certain signs for several weeks?  Scorpio is a sign which Mars is said to "rule" -- that is, it shares many of the symbolic associations of Scorpio (violence, intensity, sudden actions, etc).  Scorpio is only one zodiac sign out of 12 so Mars transits this sign once every two years or so.  When Mars is in its normal forward motion, the transit lasts about 6 weeks.  In traditional astrological terms, we say that Mars is strengthened through its transit of its own sign, Scorpio.  But in market terms, a stronger Mars probably means it will do more damage to sentiment.

So the idea that Mars in Scorpio is bearish is deductively plausible.  In fact, most astrological thinking is deductive in nature, and this is one of its weaknesses.  Mars is a bad planet, and Scorpio is a "bad" sign for Mars, so that should be really bad for markets.  Right?  (And apologies to all Scorpios here, but please note that we are talking about financial markets and not individual human beings.  Scorpios are great people!). 

But is Mars in Scorpio actually bad? What does the evidence say?  Astrology works best when it moves out of the realm of pure deduction into the realm of evidence-based empiricism.  One of the reasons I became interested in financial astrology was because it offered a constant flow of empirical data about the possible effects of the planets.  Just as the planets are in constant motion, the markets are also constantly changing. 

The table below was constructed from an admittedly small sample of the recent transits of Mars through sidereal Scorpio dating back to 1999.  There are only ten cases here, which is nowhere near enough to produce standard statistical significance.  And yet, I think the evidence presented here is at least interesting, if not impressive.  I was actually surprised the correlation was as strong as it appears to be from such a simple two-factor model. 

Market effects of the Mars transit of Scorpio (DJIA)
Entry Date  Exit Date DOW at entry* DOW at exit  % Change
     Aug 23 1999        Oct 8 1999       11,299     10,649          -6
      Feb 2 2001**       Apr 10 2001       10,983       9845          -10
     Jun 10 2001**       Aug 26 2001       10,977      10,423          -5
     Jan 7 2003       Feb 22 2003        8773       8013          -8
     Dec 16 2004        Jan 8 2007      12,280     12,423         +1
     Nov 7 2008       Dec 18 2008        8943        8604          -3
     Oct 19 2010       Nov 29 2010       11,143      11,052          -1
     Sep 28 2012       Nov 8 2012       14,485      12,811          -11
     Sep 4 2014       Oct 18 2014       17,078      16,380          -4
    Feb 20 2016**       Jun 18 2016           ???         ???            ?
    Jul 11 2016**       Sep 17 2016           ???         ???            ?
*Closing prices for day before Mars entered Scorpio
**Indicates year where Mars retrograde cycle occurred in Scorpio


In 9 out of 10 instances of Mars transiting through Scorpio, stocks declined.  In 6 out of 10 instances, stocks fell by 4% or more.  The fact that stocks declined during this transit is even more significant because the market has generally risen over that time from 1999 to 2014.  The Dow Jones Industrial Average was around 11,000 at the time of the first transit in the table and 17,000 at the time of the last transit in 2014.  So the market bias was positive overall and yet this six-week transit was almost always negative.  That's interesting.

Even more telling is that the only positive instance of Mars Scorpio transit coincided with Jupiter's transit of -- you guessed it -- Scorpio. Jupiter is a positive planet, of course, and it only transits through one sign per year.  It therefore only transits through Scorpio once every 12-13 years.  The fact that stocks rose modestly (+1%) from Nov 2006 to Jan 2007 is likely attributable to Jupiter also transiting Scorpio.  Jupiter's presence in the same sign could therefore neutralize or offset the negative Mars influence.

Unfortunately, there is no such Jupiter influence this year, as it's due to pass through Scorpio again in 2019.  And not only is Jupiter not there to lend a helping hand, but bearish Saturn will also be in Scorpio for the whole year!  This could make the Mars transit even worse.  We are therefore even more likely to see stocks fall during this year's transit of Scorpio.  And the fact that there will be two separate transits due to Mars' retrograde motion loads the dice for the bears even more in 2016.  The last time Mars had its once-every-two year retrograde cycle in Scorpio was 2001 right in the middle of a bear market.  The Dow fell 15% during the combined transits of Mars through Scorpio that year. 

So this likely means that the next few months could see more turmoil in financial markets.  Due to the April retrograde station, the first Mars transit of Scorpio lasts for a very long time, from February 20 until June 18.  Just like Scorpio likely makes Mars more damaging, so does the extra long time of the transit likely to make its effects worse than they otherwise would be.   And this is only one negative planetary influence out of several I can see this year.  No matter what tricks the central banks of the world might try to postpone this recession, I don't think they will be successful.


Weekly Market Forecast

Stocks have moved higher Monday.  Asian and Europe were sharply higher and US futures are looking to follow suit although there will be no trading today on Presidents' Day. I would think we will see more upside this week as Mercury and Venus move in tandem into Capricorn.  With the Sun safely off in Aquarius, there will likely be some room for optimism this week.  However, Mars aligns with Ketu (South Lunar Node) for much of the week so there could be some sudden sell-offs mixed in here, perhaps later in the week.

For more details on the market trends this week, this month and this year, please check out my weekly MVA Investor Newsletter.  The newsletter covers US and Indian stock markets, as well as gold, oil and major currencies.


Monday, February 8, 2016

Gold rallies amid emerging currency war

(8 February 2016)  Is gold's renewed luster for real?  Gold has been shining brightly of late as one of the few asset classes (along with bonds) that has bucked the down trend in stocks and commodities in recent weeks.  One key reason for gold's recent gains are fears that another recession may be looming which will force the world's central banks to cut interest rates further into negative territory.  Lower interest rates are designed to lower (and debase) national currencies and therefore this enhances the appeal of gold as a storehouse of value. 

Following more easing moves by their central banks in recent months, the Japanese Yen, the Euro and the Chinese Yuan among others have all fallen against the US Dollar.  We may well be entering a more intense phase of a global currency war as desperate central banks race to devalue in order to briefly stimulate economic growth through cheap exports.  Faced with the prospect of holding falling currencies, more investors are opting for gold as a hedge against this uncertainty. Gold soared 5% last week and finished at $1174 an ounce.

But we're seen this movie before.  Gold has been trapped in a four-year long bear market in the aftermath of its all-time record 2011 high of $1920.  During that time, we have seen gold attempt similar impressive short term rallies but they invariably come to nothing.  As is typical of a bear market, all these promising rallies only lasted a few weeks and then gold would fall even lower.  Are things different this time? 

My assessment of the relevant astrological influences suggests the recent gains in gold are simply another fairly typical, albeit strong, bear market rally and nothing to get too excited about. A bear market rally means that gains can come suddenly and powerfully but are unlikely to evolve into a sustainable up trend.  Therefore, they are unlikely to fundamentally change the bear market dynamic of lower highs and lower lows.

The current gains in gold in early 2016 are not surprising and I have been advising newsletter subscribers that such a rally was more likely now.  Whatever the transit effects of Jupiter in Leo (bullish) and Jupiter conjunct Rahu (North Lunar Node) (bearish), my go-to chart for gold is still the 1919 natal chart of the first public posting of gold prices from London banks on September 12 at 11 a.m.  While London is no longer the financial capital of the world it once was after World War 1, I have found this gold horoscope still seems to resonate quite closely with the major changes in gold prices. 


A quick look at the chart and we can quickly see why gold is rising here in 2016.  That Jupiter-Rahu conjunction in late Leo is conjoining the Sun-Venus conjunction in the natal chart.  Jupiter is usually bullish and its ongoing conjunction here with Rahu is also a plus as it encounters benefic planets like Venus and the Sun.  It's obviously positive and is one big reason why I had predicted some gains for gold in February in my newsletter.   To be honest, this current breakout higher occurred a few days earlier than I expected but the overall picture is very much in keeping with the standard effects of Jupiter and Rahu on a Sun-Venus conjunction. 

The question is what happens once Jupiter (27 Leo) moves past both Venus (27 Leo) and the Sun (25 Leo) in its retrograde cycle?   Jupiter is due to exactly conjoin the natal Sun on February 24th.  After that, it will separate and its potentially bullish influence may diminish.  This is not to say that gold will end its current rally and reverse lower on Feb 24th.  However, this is one important planetary factor to consider.  My sense is that the current gold rally will likely peak in late February or early March, and that March will be more bearish.  The rest of 2016 also features a number of difficult alignments that seem incommensurate with a renewed bull market in gold.  Readers may find more details in my weekly market newsletter.


Weekly Market Forecast

Stocks trended lower last week on worsening economic data and the possibility that the Federal Reserve may have no choice but postpone its announced rate hikes for 2016.  In New York, the Dow lost 2% closing at 16,204 while the Indian BSE-Sensex lost 1% to 24,616.  In last week's market forecast, I thought we would likely see the bears prevail as I thought the Mars-Sun square aspect would depress stocks through much of the week.  As expected, we did see a late week bounce near the Venus-Pluto conjunction on Thursday and Friday in India and on Wednesday and Thursday in the US and Europe. 

This week has started off negatively with stocks down in India, Europe and now in the US as the Futures are pointing to a sharply lower open. This is probably the result of the Mars-Sun square.  While this was exact on Saturday the 6th, this pattern got a second iteration from today's Moon-Sun conjunction, i.e. a New Moon.  In other words, the Moon has acted as a catalyst for the bearishness of Mars to flow to the Sun for yet another day even though Mars and the Sun are separating.  I would therefore expect the bears to carry the day on Monday.  But the rest of the week seems more bullish as Venus aligns with Jupiter and Rahu into midweek.  That increases the chances of a decent bounce once this Mars energy has manifested in the early going. 
For more details on the market trends this week, this month and this year, please check out my weekly MVA Investor Newsletter.  The newsletter covers US and Indian stock markets, as well as gold, oil and major currencies.


Monday, February 1, 2016

Bank of Japan enters twilight zone of negative interest rates

(1 February 2016) The Bank of Japan surprised financial markets last Friday by cutting its prime interest rate to -0.1% on interbank loans.   BOJ Governor Haruhiko Kuroda's shock move into the twilight zone of negative interest rates is designed to entice reluctant Japanese banks to lend more money and thereby provide a stimulus for the perennially moribund Japanese economy. Stock markets around the world reacted positively to the rate cut, even if its long term consequences are unknown. 

Negative rates force money out safe assets like bank accounts and bonds into riskier assets like stocks which have a greater potential return.  However, the negative interest rate policy (NIRP)  is new and rather experimental as the European Central Bank (ECB) was only the first major central bank to move its rate below the 'zero bound' in June 2014.

This move into negative rates seems a bit desperate as central banks are now realizing the limits of the effectiveness of its previous preferred monetary instrument of quantitative easing (QE).  But with the global economy careening towards another recession, central banks may be willing to try anything to boost economic activity, even if it means punishing savers even more and creating unknown systemic risks.  If rates continue to move further into negative territory, individual depositors may for the first time have to pay to keep their money in a bank.  It is unclear at what point this policy would backfire and prompt a bank run as customers withdraw their cash.

The astrological angle here is that the BOJ's step into the financial unknown seems reflective of the symbolism of Rahu.  Rahu is the Sanskrit name for the North Lunar Node, a calculated astronomical point in the sky that marks the intersection between the orbits of the Moon around the Earth and the Earth around the Sun. These two Lunar Nodes, aka Rahu (North) and Ketu (South) are prominent in eclipses -- traditionally seen as bad omens -- and thus they carry a malefic significance in traditional Indian astrology. 

Currently Rahu (28 Leo) is conjunct Jupiter (28 Leo), the planet of wealth and expansion.   When it is prominent as in such a conjunction, Rahu is regarded as a source of distortion and deception either through deliberate or accidental intent.  It is also closely associated with acquisitiveness and greed, as in the pursuit of material gain and wealth. How appropriate that distorting Rahu should be conjunct Jupiter (wealth) as the world's central banks invent new ways to keep the game going and avoiding a debt-ridden financial collapse. 

Actually, Rahu can actually be a positive influence in the charts of some people in terms of worldly success and income, even if it may sometimes mean they use deceptive means to achieve their ends.  At other times, Rahu may simply symbolize the ambition to succeed itself rather than impugning any negative motives or means.  My own investigations into Rahu suggest that it also has a more positive side as it is found in the charts of people who are innovators and mavericks.  Rahu is also closely associated with notions of scientific research and more generally, breaking boundaries of tradition and conventional wisdom. 


So it is not difficult to see how the Bank of Japan's move into negative interest rates reflects some Rahu's notions of innovation, experimentation and research as they pertain to wealth (Jupiter).  But Rahu's malefic side is never far away, and in some instances it can have a distorting effect on wealth creation.  Stock markets may have risen on this news, but it is possible that these central bank policies may be distorting the natural market mechanism as stock prices have moved away from financial fundamentals such as corporate earnings.

Interestingly, another Jupiter-Rahu conjunction occurred in the fall of 1979 and coincided with another bold central bank move. In October 1979, then Fed Chair Paul Volcker radically hiked interest rates to choke off inflation that had entered double digits in the US.  Although controversial at the time, Volcker is now seen as a hero for his innovative (Rahu) moves to reduce inflation (Jupiter) and put the economy on better long term footing for the 1980s. 

The comparison between 2016 and 1979 also has another similarity.  In both instances, the Jupiter-Rahu conjunction took place in the sign of Leo.  Perhaps not coincidentally, Leo is the zodiac sign most connected with government.  Central banks are agencies of the government so it stands to reason that their actions may have important consequences. 

A third parallel. Both in 1979 and in 2016 the conjunction takes place twice:  first when Jupiter is retrograde and second when it is in direct motion.  Due to Jupiter's retrograde motion in 1979, there were actually two periods of conjunction, the first from October 13 to November 26 and the second from March 3 to May 6, 1980.  This year we will also have two Jupiter-Rahu conjunctions since Jupiter is retrograde now but will turn direct later.  Please note that I am using a five degree orb of separation both applying and separating.  This is a commonly-used orb for conjunctions, although I admit it is possible to use other orbs.  Volcker's bold move was taken on October 6, just a week before Jupiter had moved to within five degrees of Rahu. 

As a side note, gold famously spiked to a then record high of $800 in early January 1980 right in between these two Jupiter-Rahu conjunction periods. Gold had modestly climbed about 5% in the first period in Oct-Nov but then fell 20% during the second March-May 1980 period after gold had peaked in January. This largely negative outcome is in keeping with planetary symbolism.  Jupiter is sometimes seen as an indicator for gold, so any afflictions to it by malefics like Rahu are more likely to coincide with declines.  All other things being equal, this could be a negative factor weighing on gold prices in 2016.

This year we also have a double Jupiter-Rahu conjunction since Jupiter is again retrograde when it conjoins Rahu.  This is arguably another astrological reason for the BOJ's radical move.  The fact that Rahu is afflicting Jupiter for a longer period as both planets move backwards suggests that it can do more to disrupt the economic norm.  The current conjunction began on December 11, 2015 and will continue until March 19, 2016.  Then Jupiter will reverse its direction on May 9th at 19 Leo and begin to move forward again.  It is due to conjoin Rahu again from May 23 until July 14.


Market impact of Jupiter conjunct Rahu (i.e. North Lunar Node)
Effective dates
DOW Net Change % change
Oct 13 1979 - Nov 26 1979 (Jupiter Rx)  838-828 = -10       -1
Mar 3 1980 - May 6 1980* 854-816 = -38       -4
Mar 29 1987 - May 9 1987 2335-2322 = -13        0
Sep 11 1994 - Oct 23 1994 3860 - 3891 = +31      +1
Jul 18 2001 - Aug 29 2001 10,569-10,090= -479       -4
Jan 23 2009 - Mar 5 2009  8077 - 6594 = -1483     -19
Dec 11 2015 - Mar 19 2016 (Jupiter Rx) 17,524 - ????       ?
May 23 2016 - Jul 14 2016*   ??? - ???       ?

 
It is important to note that this Jupiter-Rahu conjunction is fairly rare and only occurs once every 7 years.  Since both planets are fairly slow moving, the conjunction lasts for about 6-7 weeks, although the conjunction is longer when Jupiter is retrograde and hence moving more slowly.  From the table above, there is even a hint that Jupiter-Rahu conjunctions could have a negative impact of stock prices although the correlation seems less than robust. 

The major decline in 2009 was likely worsened because Jupiter was debilitated in the sidereal Capricorn that year (Western tropical astrologers, take note).  This likely weakened Jupiter so it was even less able to withstand the disruptive effects of Rahu.  At the same time, the neutral outcomes of the 1987 and 1994 Jupiter-Rahu conjunctions were actually relatively bearish given that stock markets were in the middle of major bull markets at that time.  In that sense, even a neutral outcome is evidence of a negative influence that suppressed prevailing bullish sentiment. 

The current Jupiter-Rahu conjunction has coincided with stocks falling again.  US markets have fallen by more 10% since December 11th at the start of the conjunction although they appear to be rebounding at the moment. Certainly, it isn't the only astrological influence at work but it may well be one piece of the puzzle.  We still have another 6 weeks to go before the current conjunction separates by more than five degrees.  Can stocks extend their rebound in the coming weeks?  It's certainly possible, especially since the market has declined significantly already.  The Dec-Jan decline that we've already seen may well have fulfilled the bearish potential contained with the Jupiter-Rahu conjunction.  But the fact that there will be a second Jupiter-Rahu conjunction from May to July should give investors pause.   This is yet another reason why 2016 could be a more turbulent financial year.


Weekly Market Forecast

Stocks climbed last week, especially after the Bank of Japan's surprise rate cut on Friday.  US stocks rose 2% as the Dow finished at 16,466 while India's Sensex added a similar amount finishing at 24,870.  In last week's stock market forecast, I thought there was a higher probability of declines later in the week but stocks actually bottomed out before that on Wednesday after the Fed disappointed markets with its no-change stance.  .

This week leans bearish, especially in the first half.  Thus far, Monday has been mixed in Asia and negative in Europe with a lower open likely in the US as I write this.  The planetary problem here is that Mars is approaching its square aspect with the Sun this week.  This isn't exact until Saturday the 6th, so there could be some pessimism expressed at various points through the week.  That said, I don't think it will be negative for the whole week. 

But the Mars-Sun square aspect is one of those fairly reliable negative aspects  that correlate with declines.  With Monday likely ending negative in Europe and the US,  Tuesday could also be problematic as the sensitive Moon is caught in the middle between malefics Mars and Saturn.  Wednesday's Moon-Saturn conjunction also looks iffy.  I would think sentiment may improve by Thursday or Friday when Venus conjoins Pluto and aligns with the Sun, Mars, and Uranus. For more details on financial trends this week, this month and this year, please check out my weekly MVA Investor Newsletter.  The newsletter covers US and Indian stock markets, as well as gold, oil and major currencies. 


Monday, January 25, 2016

Oil tells all: markets take their cue from crude

(25 January 2016) Are we there yet?  Investors are wondering if this January decline might finally be done with or if this is only be a nasty prelude to a more tumultuous financial year in 2016.  My assessment of the planetary influences suggest there is a higher than normal risk of more downside in both the short and medium term. There are several useful charts in this respect but perhaps none is more important these days than the chart for crude oil futures. 

As we have seen, the stock market is currently being driven by oil prices.  If oil falls, stocks also fall soon after.  One reason for this close correlation is that oil prices have fallen so far that many oil companies are in financial trouble.  Most have laid off workers, and some are on the verge of insolvency.  In particular, some US-based companies borrowed heavily for capital-intensive shale fracking operations.  As these companies go under, they will no longer be able to repay their debt and hence the banks that loaned them money will also be in trouble.  The financial contagion will thereby be released upon a vulnerable economy.   As the world's pre-eminent commodity, crude oil prices are also seen as a proxy for the state of the global economy.  The falling prices in the oil market are signaling that the economy is slowing as China and other emerging markets cut their consumption levels amid rising debt. 

The bottom line here is that as oil goes, so goes the stock market.  If oil falls further, it seems very likely that stocks will also fall further.  A rebound in oil either through tightening supply or increasing demand, or conceivably a fall in the US Dollar would give a boost to the stock market.  So what is the price outlook for oil?

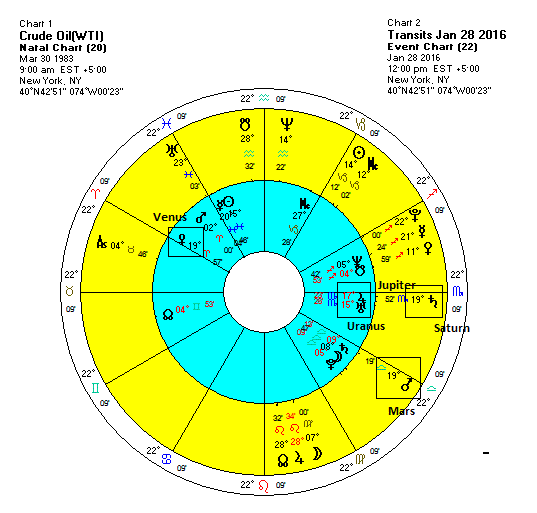
Previously, I looked at the Brent Crude Oil horoscope and found strong evidence for depressed prices in 2015, 2016 and beyond.  Not surprisingly perhaps, a quick look at the first trade horoscope for West Texas Intermediate (WTI) on the NYMEX also shows why the oil market is so weak at the moment.  As is so often the case, the planetary cause of falling prices is Saturn.  Transiting Saturn (19 Scorpio) is in a tight conjunction with Jupiter (17 Scorpio) in the 7th house of the chart opposite the Ascendant,.  Secondarily, Saturn is also conjunct nearby Uranus (15 Scorpio). 


Saturn was exactly conjunct Jupiter two weeks ago when crude oil fell through support at $35 -- a moment of maximum affliction by Saturn. While Saturn's bearish influence may be lessening to some extent since it is now past exact, it may not travel far enough away from Jupiter to make much of a difference in terms of overall trend.  Saturn is due to station retrograde at 22 Scorpio in late March and then come back and conjoin that natal Jupiter once again in June.   We could easily see another push lower then.  As the most distant of the observable planets, Saturn only moves 12 degrees per year including a four-month long retrograde period and thus its conjunctions can take many months to play out.  It therefore seems likely that Saturn's proximity to natal Jupiter will mean that oil will fall further in 2016, possibly reaching that $20 target that many analysts have highlighted.  Saturn stations direct in August at 15 Scorpio and will then conjoin that Jupiter once again in September.  As a general rule, Saturn conjunctions are bearish for prices for most assets. 

To be sure, the entirety of the collapse of oil prices since 2014 cannot be solely accounted for by the movements of Saturn. The initial price decline was also associated with Ketu (South Lunar Node) which conjoined Mars (2 Aries) in mid-2014 at the start of the decline below $100 and then later, in part, through its conjunctions with Mercury (20 Pisces) and Sun (15 Pisces).  That said, these simple transits do not account for all of the variation in the price of oil but they play a large role in determining if oil is rising, falling or going sideways. 

The near term outlook looks challenging.  Saturn may be losing some of its negativity but the planets this week argue for more downside.  The late week transit of Mars (19 Libra) opposite the natal Venus (19 Aries) in the WTI horoscope may well coincide with significant downside, especially since it also aligns with Saturn.  February could see some improvement but the gains may come in fits and starts and probably won't be enough to change the overall bearish outlook for oil.  March seems a lot more difficult as Saturn stations and begins to move back towards Jupiter again. 


Weekly Market Forecast

Stocks bounced last week as crude oil finally reversed its downturn.  US Stocks rallied 2% on the week after making a potentially significant intraday low on Wednesday while Indian stocks enjoyed a more modest gain.  While I was somewhat bearish in my bias in last week's market forecast, I was uncertain if the ongoing alignment of retrograde Mercury with Pluto, Uranus, Saturn and Mars would yield declines last week or this week. 

This week is off to a mixed start as Asian markets were somewhat higher while European stocks finished a bit lower.  US Stocks are down by less than 0.5% and crude is down by 3% as I write this post.   I still think there is a greater risk of declines this week even if we get some upside along the way.  We will see Mercury station direct later on Monday (EST) so that could change the mood of the market.  And the Mars-Saturn alignment will tighten on Thursday and Friday so that may be a more likely time when stocks will fall.  Interestingly, Fed Chair Janet Yellen is due to issue its latest policy statement on the economy on Wednesday.  For more details and a longer term forecast for February and beyond, please subscribe to my MVA Investor Newsletter.

Monday, January 18, 2016

The China Syndrome: the world's economic engine stalls

(18 January 2016) Financial markets continue to look shaky as the 'China Syndrome' threatens the global economy.  After many years of impressive economic growth, China is showing more signs that its once-powerful economic engine is sputtering. This is one of the main reasons why crude oil has fallen below $30 a barrel and most stock markets have declined so far in 2016.  As China goes, so goes the global economy.   If China is forced to further devalue its currency to boost its exports and protect jobs, we can expect more trouble for global stock markets this year.

But is China really headed for a "hard landing" whereby their economy contracts sharply or perhaps even enters a full-blown recession?  Previously, I looked at the horoscope of the Shanghai stock exchange and found ample evidence for a significant decline in January.  The main Shanghai Index is has now fallen below 3000, a key technical support level.  Some analysts are now suggesting more downside to perhaps its previous low of 2000.  My assessment of this chart suggests that more downside is very likely this year.  The Saturn retrograde station in March will align closely with the Moon this chart, while the Uranus station (0 Aries) in the summer will square the natal Saturn (0 Capricorn).

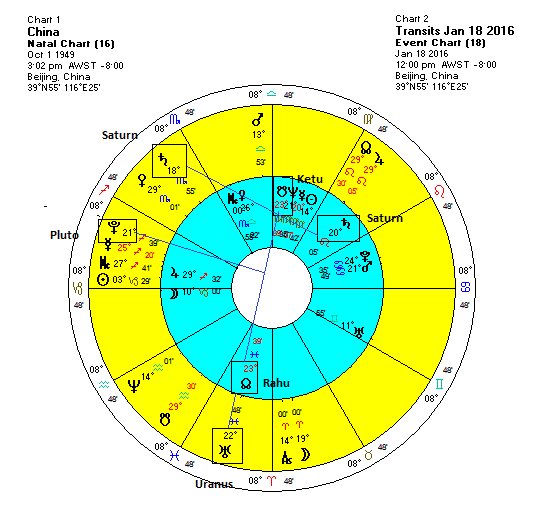
Significantly, we can see a similar pattern of affliction this year in the national chart of China (1 October 1949).  Although stock market movements are only indirectly related to the national horoscope, economic conditions are usually reflected in the chart, especially when they diverge from the norm.  This is definitely the case in 2015 and 2016 as transiting Saturn (18 Scorpio) squares its natal position in the 8th house.  Saturn in the 8th house in Leo is a very conservative influence and reflects the necessity of maintaining strict political control over that society.  Since Saturn is the ruler of the chart (since it rules the 1st house Capricorn), the sense of restriction and conservatism is even more pronounced. 


To be sure, the aspect from Jupiter indicates that China benefits greatly from this reliance of tradition and order.  The stifling of political dissent and opposition to the one-party state has forced the population to focus on building the economy as a patriotic duty.  But when transiting Saturn casts its full-strength square aspect from Scorpio to natal Saturn, even this positive Jupiter influence is likely to be overwhelmed.  Frustration and national anxiety are likely to manifest with scandals (8th house) popping up with more frequency.  Recent months has seen a series of hedge fund managers and other highly placed investors disappearing for a time, presumably to be "interviewed" by the government.  Last summer's stock market rout was deeply embarrassing to Beijing despite issuing edicts which banned short selling and forced major banks and brokerages to buy stocks in order to support prices.

The problem for China in 2016 is that Saturn will station at 22 Scorpio in March and then move backwards for the next four months.  It will thereby maintain is aspect to natal Saturn and this will likely keep the economic pressure on.  Saturn is first and foremost a restrictive influence, so all this Saturn energy will likely see the economy contract further this year.  Of course, Saturn also rules Aquarius, which is the ruler of the 2nd house of wealth in the national chart of China.  This ongoing Saturn transit will therefore likely see the net wealth of the country also decline, or possibly expand at a slower rate, at least for the duration of the transit.  The slowdown is more likely to be disruptive to society since both Uranus (22 Pisces) and Pluto (21 Sagittarius) align with the nodes, Rahu and Ketu.

I would expect China's economy to continue to struggle throughout 2016 so a hard landing looks inevitable.  We will also likely see more authoritarian actions by the government as Beijing attempts to tame the capitalist tiger.  Transiting Rahu's conjunction to natal Saturn in July will likely highlight another period of extreme instability.  Saturn's square aspect will finally begin to separate and diminish in the fall. 


Weekly Market Forecast

Stocks fell again last week as crude oil extended its slide to below $30 a barrel for the first time since 2004.  US stocks fell 2% as the Dow finished at 15,988 while markets in India  also lost more than 2% as the BSE Sensex ended the week at 24,455.   In last week's stock market forecast, I thought we might have got more gains on Thursday's Sun-Mercury-Jupiter-Rahu alignment.  Thursday was higher in the US but stocks were lower for most of the rest of the week.   As I noted, however, the presence of unpredictable Rahu (North Lunar Node) somewhat lessened the favourability of this pattern. 

This week has started off modestly negative in Asia and Europe as US markets are closed for the MLK holiday.   There are no clear planetary indications for this week although it is hard to be optimistic.  The ongoing Jupiter-Rahu conjunction is still very close this week (and next) and that may make the prospects for a rebound more unlikely.  Another source of instability could be Mercury retrograde which conjoins Pluto and aligns with Uranus late in the week.   I'm not sure it will correlate with much downside this week, however.  It's possible of course, but the problem is that Mercury will then align with planetary bad boys Mars and Saturn next week.  This alignment looks even worse so stocks could be under more pressure.  For more details on these and other alignments, please check out my subscriber newsletter.

Monday, January 11, 2016

Is 2016 going to be as bad as 2008?

(11 January 2016) Stocks fell sharply around the world last week as China's financial turmoil threatened to undermine the fragile economic recovery.  As China's devaluation of the Yuan sideswiped markets, US stocks had their worst start to the year in history falling 6% as the Dow closed at 16,346.  Indian stocks also slumped 4% as the Sensex fell below the key 25,000 level.  This outcome was in keeping with my stock forecast from last week as I thought the Mars-Mercury square aspect would likely cause some significant damage.  This was not just any old Mars-Mercury square, of course, but a particularly nasty one since Mercury turned retrograde on the very same day the 90 degree angle was exact!  Asian markets have extended their decline on Monday at this time of writing although European stocks are mixed.

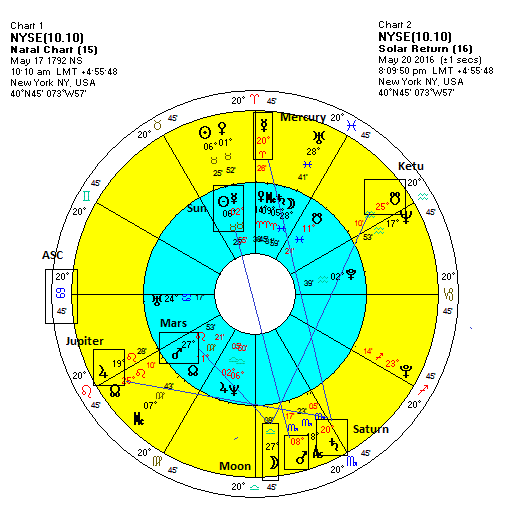
To be sure, the New Year is off to a shaky start.   Is the six-year long bull market in stocks finally over?  One now reads more gloomy forecasts in the media that suggest that 2016 might even be a repeat of 2008 when the world economy came to brink of collapse.  My previous research on this subject suggests the odds are very high that most stock markets will decline significantly in 2016 and we could well see the end to this bull market in the US and Europe.  It is already over in the stock markets of many emerging economies.  This is evident in the New Year's horoscope and the annual May horoscope of the New York Stock Exchange (NYSE).  One of the most useful tools in financial astrology is the solar return chart, i.e. the horoscope that maps the position of the planets on the birthday of a stock exchange or stock index.  The NYSE 2015 Solar Return chart (Varshphal) looked quite bearish given the close Saturn-Sun square aspect.  This strongly points toward a negative performance of US stocks between May 2015 and May 2016.  The Dow hit its all-time of 18,351 just two days after its 223rd birthday on 17th May 2015.  Currently, it is still just about 10%  below that level now despite the recent turbulence.  But if my assessment of the Solar Return chart is correct, the Dow will remain well below its high by the end of the Solar Return chart in May 2016, and probably lower than its current level of 16,346 for the Dow. 


The next twelve period from May 2016 to May 2017 is also strongly pointing to more downside.  On the plus side, SR Saturn (20 Scorpio) is no longer aspecting the natal Sun (6 Taurus) but it does form a troubling alignment with both SR Mercury (20 Aries) and SR Jupiter (19 Leo).  Mercury and Jupiter are usually sources of optimism but Saturn's alignment here may effectively block that from manifesting for the next year.  And depending on the accuracy of the exact time of this chart (I use 10.10 but there are many others) and hence the Ascendant position, Saturn may also be exactly aligning with the Ascendant. 

An additional problem for this chart is that malefic Mars is closely opposite the Sun and Mercury.   Like Saturn, Mars is associated with declines especially when it aspects key planets like the Sun or Moon.  Whereas Saturn is pessimistic and depressing of sentiment, Mars is associated with fast-paced and shocking changes.  For its part, the SR Moon is aspected by disruptive Ketu.  It also aligns with the natal Mars. This increases the probability of not just a down year, but a year that will be volatile and unstable. 

Whether or not 2016 will be a repeat of the crisis of 2008 is hard to predict on the basis of this single chart.  But overall I do think there is considerable risk of a sizable decline in world markets in 2016 that is at least reminiscent of the level of financial chaos we saw eight years ago.  As Mark Twain said, "history doesn't repeat itself, but it does rhyme."


Weekly Market Forecast

Despite Monday's large decline in Chinese markets, the planets look bullish this week.  Tuesday's alignment of Venus with Uranus and Pluto is often positive for stocks and commodities and should boost sentiment early in the week.  Thursday's Sun-Mercury conjunction happens to coincide exactly with a nice aspect from Jupiter.  Although both Mercury and Jupiter are retrograde here alongside the often unpredictable Rahu, this four-planet combination still looks good. 

Once the Sun-Mercury conjunction separates late on Thursday and Friday, there may be less positive energy available, however.  Readers seeking more details and a longer term forecast may check out my subscriber investor newsletter.


Monday, January 4, 2016

Global markets decline after China's plunge stops trading

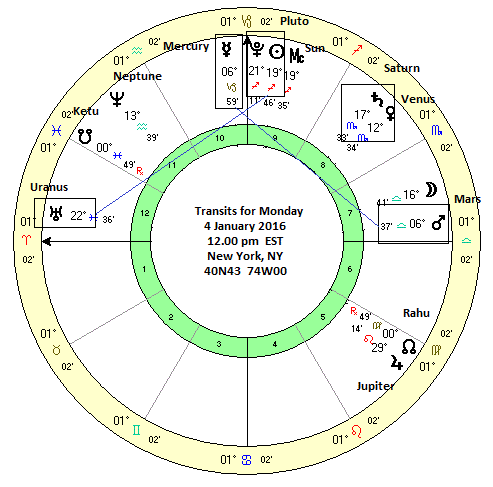
(4 January 2016)  2016 has started off on the wrong foot as global stocks declined sharply Monday following a 7% plunge in the Chinese market that triggered circuit breakers and an early closing of the Shanghai Stock Exchange.  The decline is pretty much what I expected given the very difficult planetary alignment this week.  As I briefly mentioned in last week's market forecast and elaborated more fully in my subscriber newsletter, the Mars-Mercury square aspect was more likely to correlate with declines here because it was in effect for an unusually long time due to the approach of Mercury's retrograde station on Tuesday, January 5th.  

The retrograde station is the day in which Mercury stops its normal forward motion and then begins to reverse its direction in the sky from our perspective on Earth.  The Mercury retrograde cycle occurs every three months and lasts for about 20 days.   While its retrograde cycle is traditionally associated with miscommunication and failed plans, I have found the days around its stations to be more specifically relevant to the financial markets.  If Mercury reverses its direction (i.e. stations) while making a close aspect with a malefic planets like we got last week and this week with Mars, then declines are: 1) much more likely and 2) more likely to be large.   But it is important to note that Mercury retrograde stations are a two-way street.   If they occur while Mercury forms a close aspect with a benefic planet like Venus or Jupiter, then stocks are likely to rally higher.


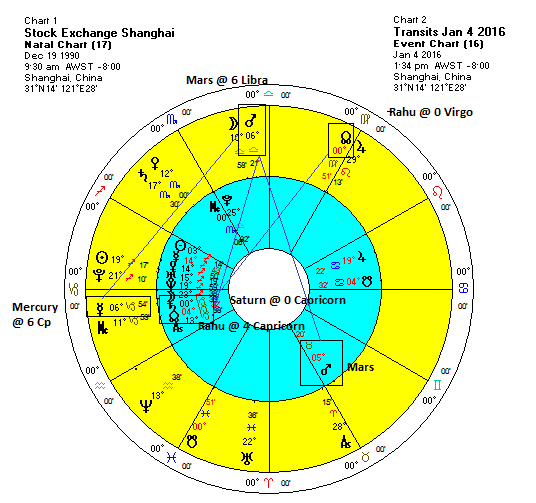
We can see how the Shanghai Stock Exchange chart got hit hard by this square of Mars (6 Libra) and Mercury (6 Capricorn) as it activated the North Lunar Node, Rahu (4 Capricorn) quite closely.  Mars also cast a very close and malefic 8th house quincunx aspect (210 degrees) to the natal Mars (5 Taurus) within one degree.  Mars-Mars aspects are also usually high probability bearish indicators.  By themselves, these factors would likely coincide with a significant down day of perhaps 2-3%.  However, there is bigger affliction here that likely explained why China's stocks fell limit down 7%.  Transiting Rahu (0 Virgo) is exactly aspecting natal Saturn (0 Capricorn) by its 120 degree aspect.  Rahu-Saturn aspects are usually bad news for stocks just as Mars-Mercury aspects are.  But since both Rahu and Saturn are slower moving planets, they are more likely to represent deeper declines as well as down trends that last for several days, if not weeks. 

While the steep decline on first trading day of 2016 seems to be a bad omen for the year, there are other ways of assessing the probable direction of stocks for the year to come.  In my New Year's Day chart analysis, I suggested that this same planetary alignment at midnight on New Year's Day could be a negative influence for the year.  This was due to the slow-moving Mars-Mercury aspect which was still very close to exact on January 1st. 

The New Year's Day horoscope arguably has a greater symbolic importance for annual collective sentiment than the outcome of the first day of trading.  In that sense, this very bearish Mars-Mercury aspect has now taken on a greater significance for the year as a whole.  This is another reason to expect a more difficult year in the stock market in 2016, particularly in US and Europe which were only down slightly in 2015.  Emerging markets like India are unlikely to escape this negative influence, although the percentage declines may be somewhat less since they already suffered greater losses in 2015.   You can find a more detailed forecast for the weeks and months ahead in my weekly subscriber newsletter.


We could see more downside tomorrow and even into Wednesday as the Mars aspect to Mercury is still within range.  However, we could see some changes in the second half of the week.  By Wednesday, Mars will be separating from Mercury and the Sun will align with Pluto and Uranus.  This offers more positive outcomes although even here the Pluto influence is a big question mark.  Thursday and Friday's Venus-Saturn conjunction looks bad for assets like gold but could be better for stocks.  I would not rule out any particular outcome this week given the high density of close multi-planet aspects in play here.  It should be a fascinating and volatile week.